Semaai
Project type: Improvement
Sales productivity increased with real time update data driven
The Semaai agent application is a SaaS application that is used by Semaai sales teams in the field for their activities such as attendance, checking achievements and profiling Semaai customer stores and others productivity. But field team find it difficult to use this app for MVP version
My Role :
UX researcher, visual and interaction designer
Timeline
Q2 - Q3 2023
10 mins read

Semaai Agent App
As a sales, it is hard to track my productivity and my selling performance without real time data, I need one of them as my motivation to be able to continue performing.
Project Background
Relation between salespersons and customers is one of the biggest factors in adopting every features in Semaai marketplace app, which will occur by visiting the users. By increasing the efficiency of visit, we are increasing the effectiveness of each visit done by salesperson, and increasing salesperson productivity.
The efficiency of visitation is still low since the salesperson not planning their visit based on untapped users. In most cases, they visit the users that already has personal connection rather than trying to visit untapped users. Salesperson don't end up visiting the right customers/ the once who are less active on the Digital product.
Semaai agent app need to be fixed because it plays an important role in company regarding promotion, selling and distribution process.
On this project, we divided the focus into 2 main aspects:
Redesigning agent app interface following UI structure. We try to build hypothesis and conducting heuristics evaluation with team to find possibility pain points and will be validated through research.
Fixing broken user experience in agent app.
We need to know and mapping every pains and blockers that face by Semaai salesperson in field. This projects involved stakeholders in different position such as: COO, manager of operational division, CTO and product manager
Challenges
Why should we re-work this?
Finding the objective of this feature
Previously, this agent app already existed and was specifically used for sales teams in the field who were responsible for managing product marketing in rural areas. The use of this application is for attendance, tracking the success of sales performance carried out by sales individuals. But we found that sales often only visit stores that regularly make purchases (retention) and ignore other stores (adoption). Of course, this means that new customer acquisition (unique customer visits) cannot be achieved, so further development of this application is the "daily visit recommendation" feature which we believe will increase the number of unique customer visits.
Real time performance tracking
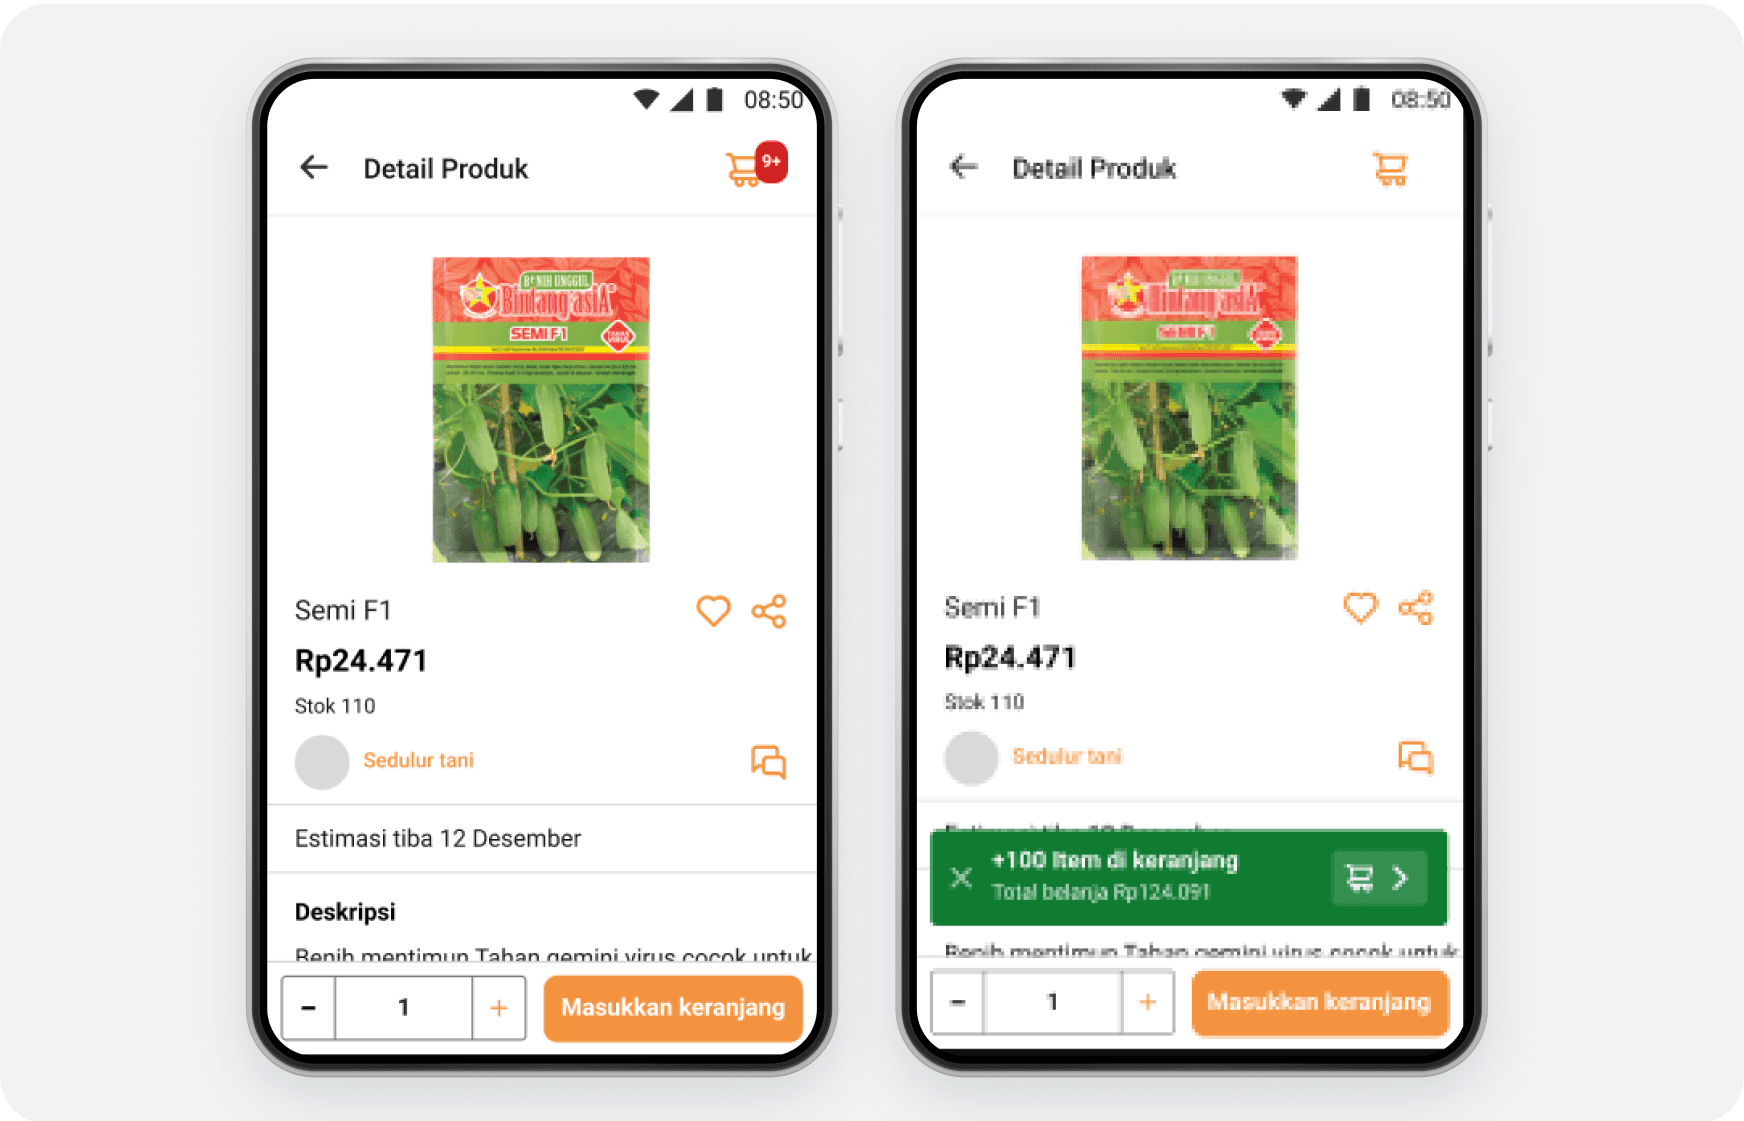
Sales will get a bonus if they successfully achieve the targets set by company management. This feature had existed before but was not optimal because the information provided was unclear and not real time. This was also confirmed by the salespeople themselves who complained about a mismatch between recording and performance itself and also a messy UI. By improving this feature, our goal is to make all transaction and sales information as transparent as possible, this is also for psychological tricks and self-motivation for sales so they can perform better and benefit the business.
Design Process

This was not a linear process, but overall workflow looks like this
UX audit by teams
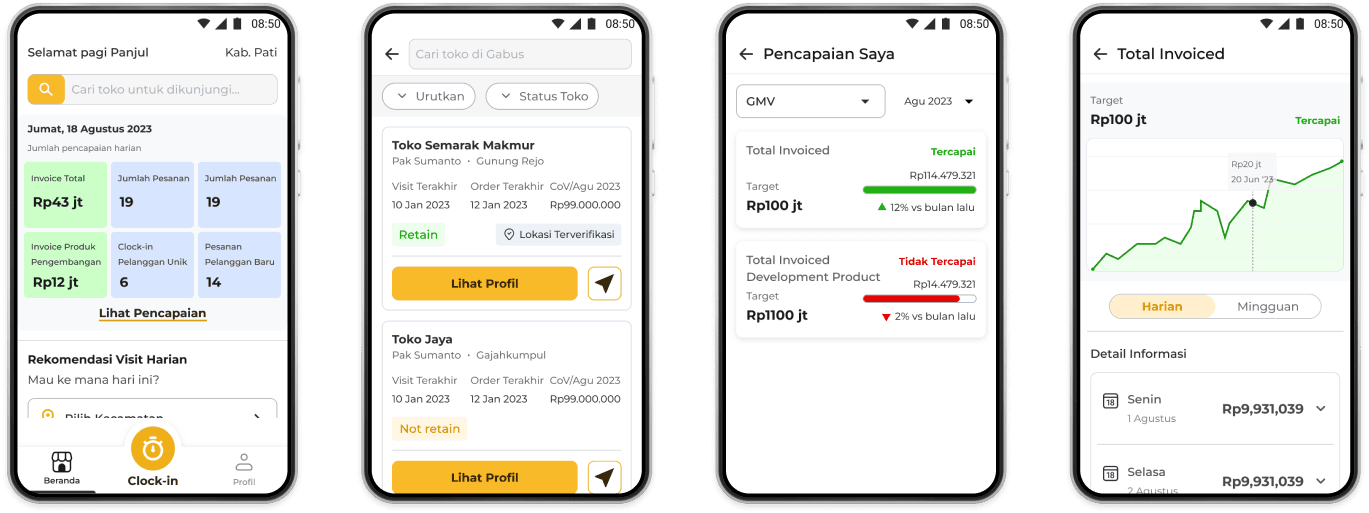
Old interface
Homepage

Target Tracking Page
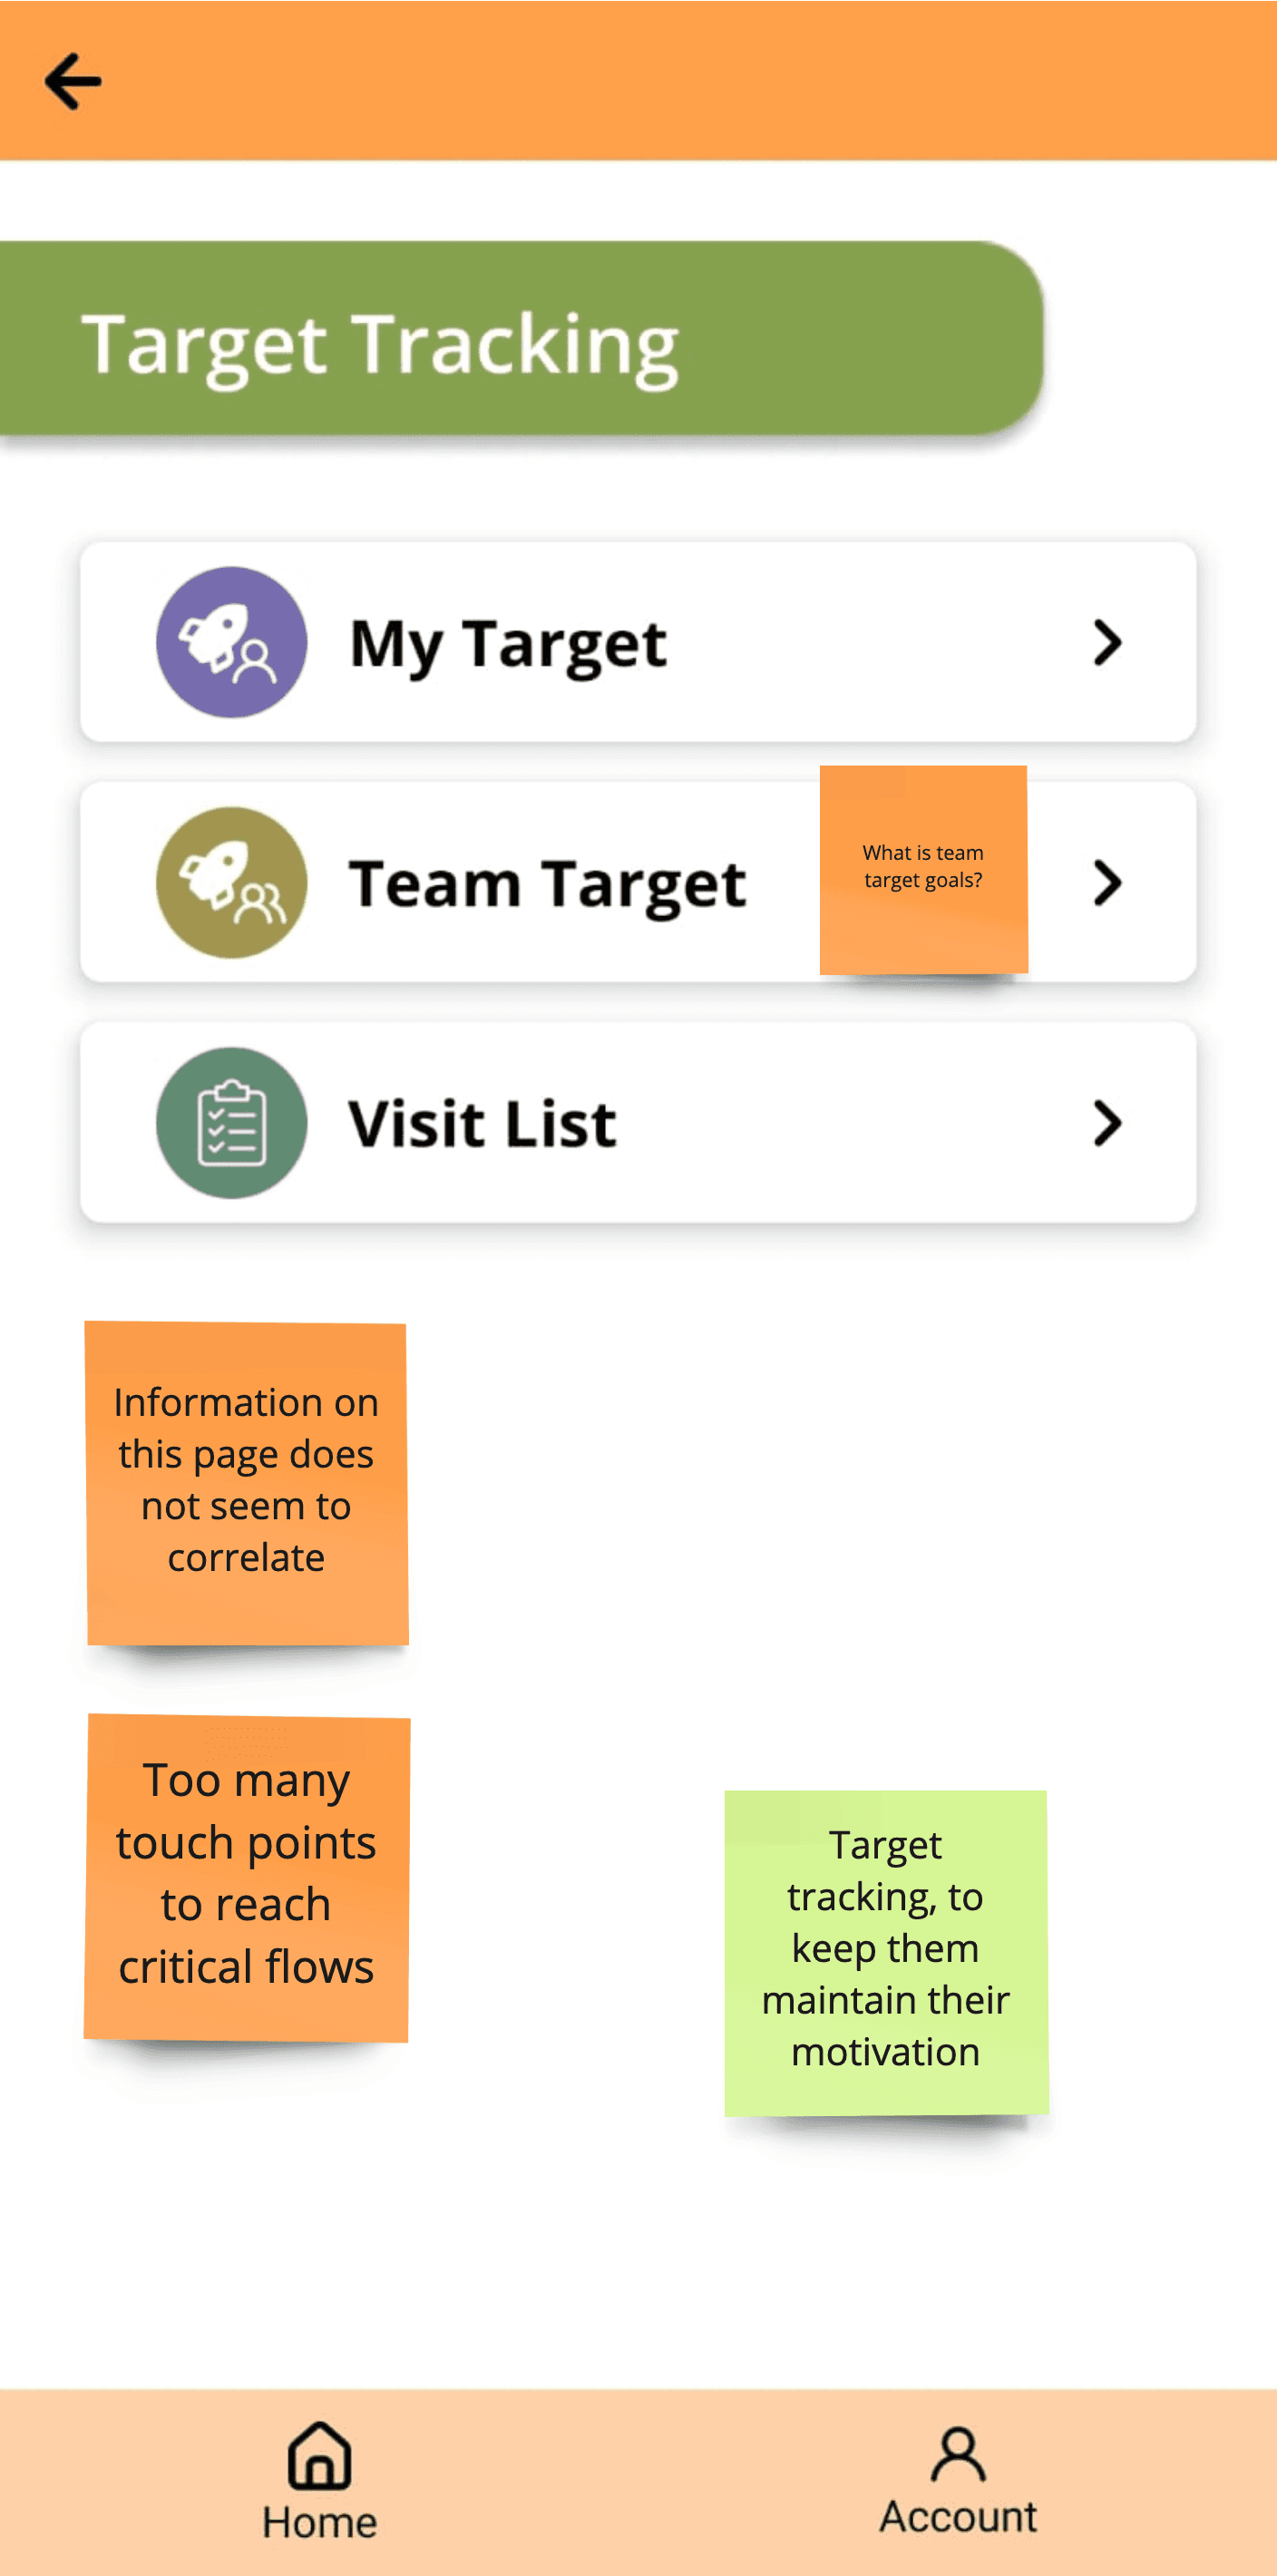
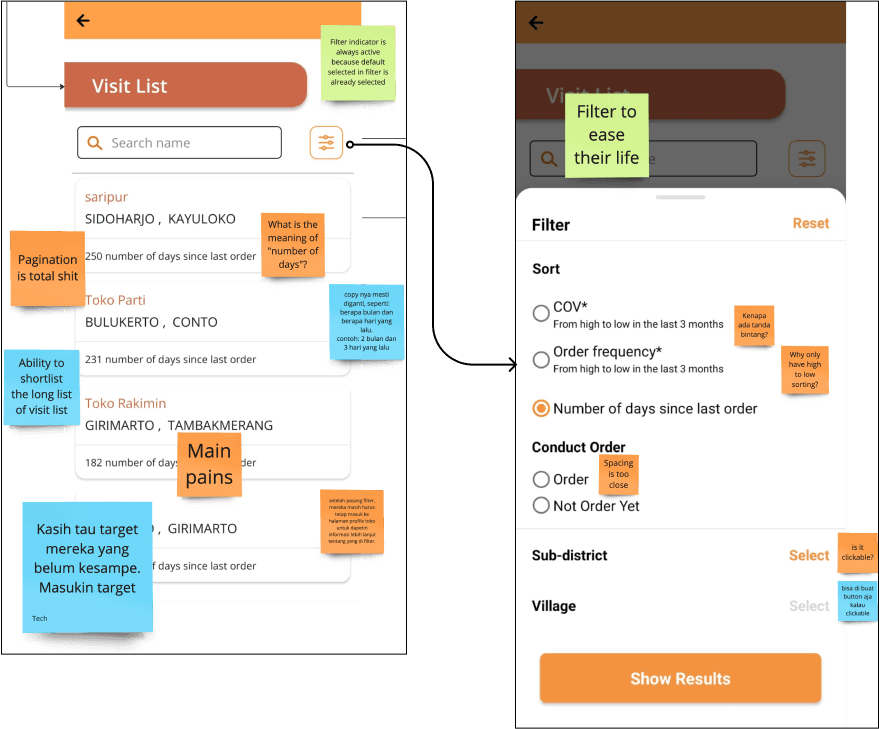
User flow to reach visit list recommendation is too long
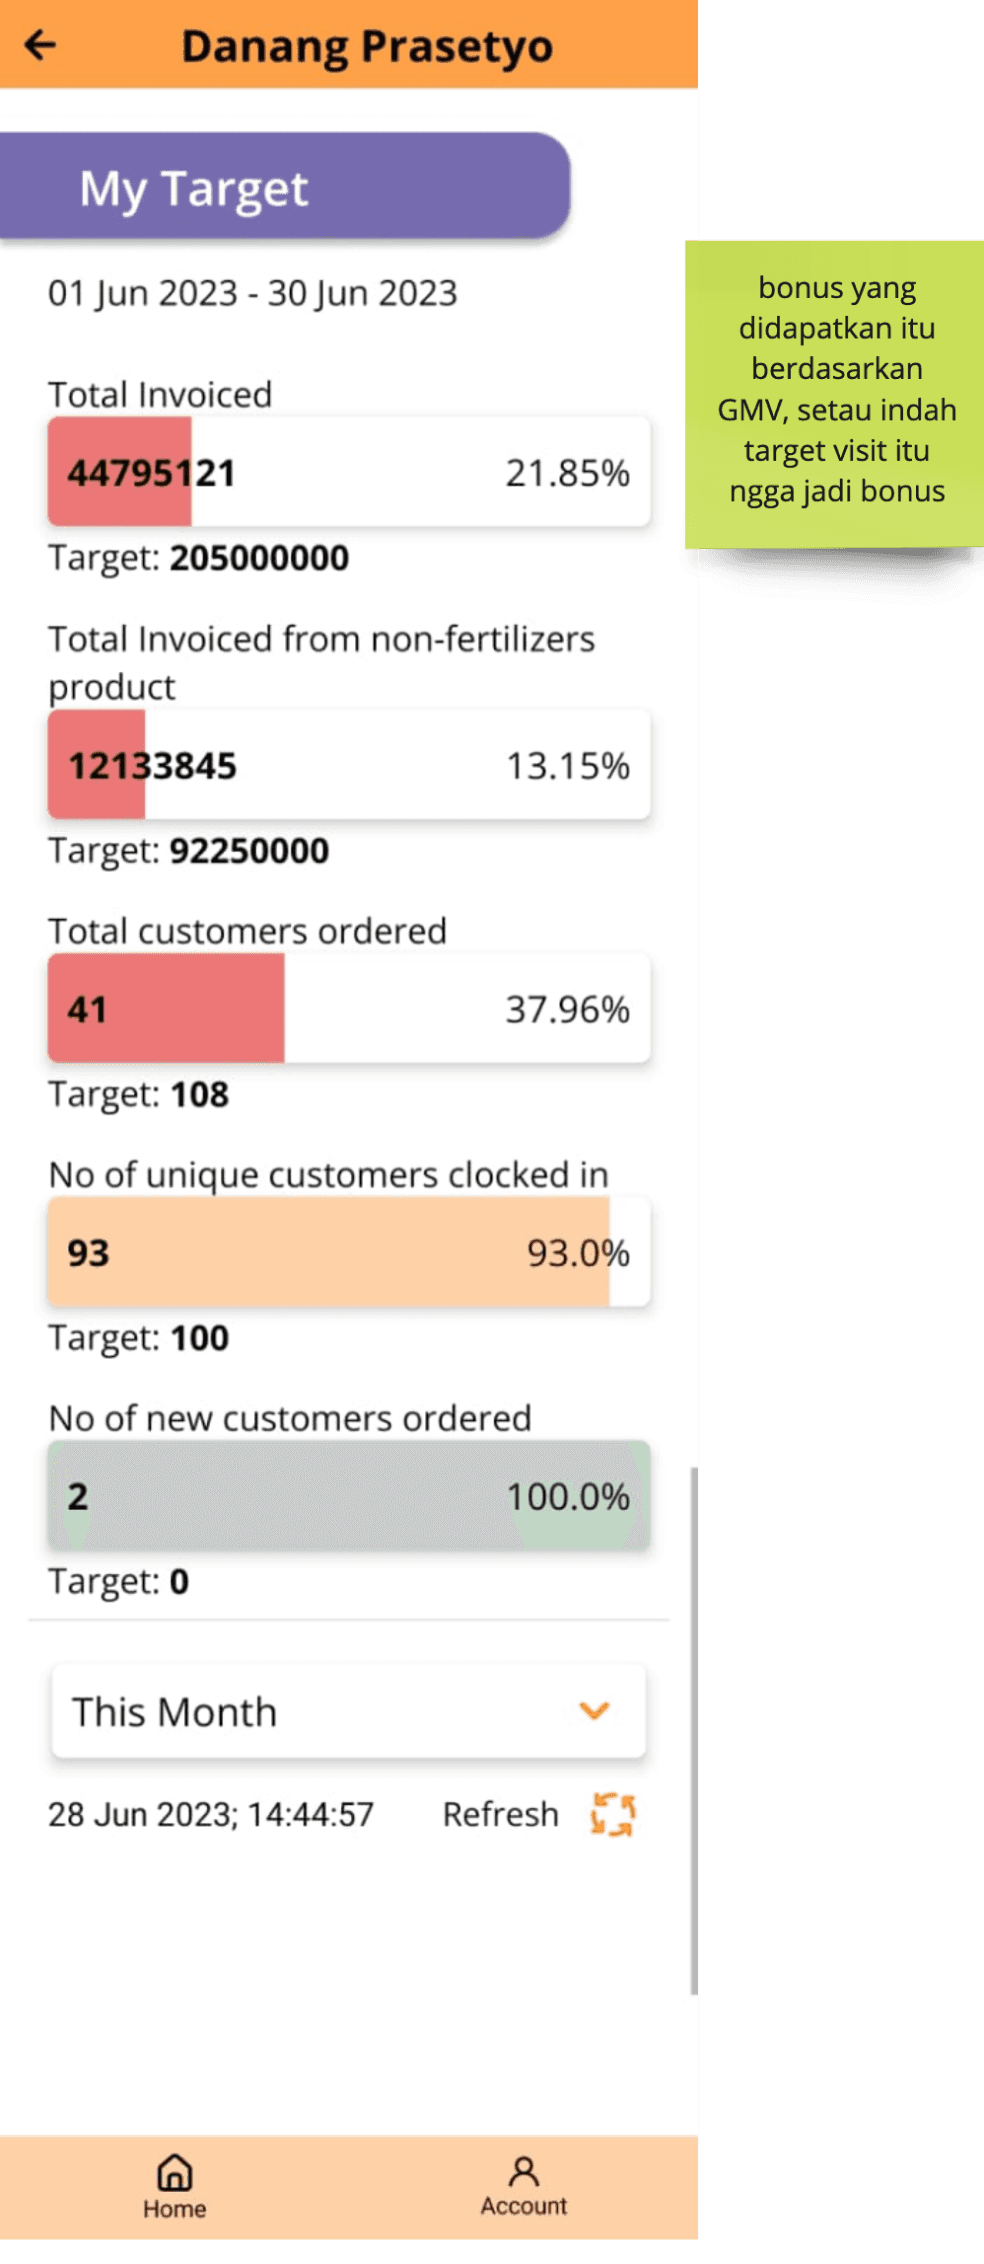
Achievement Page
Visit List Page
Customer Profile Page

User Research, Validating the Assumptions & Findings
We conducted research session together involving me as product designer, UX researcher and product manager.
Objective
Understand on how they use Semaai Agent apps
Understand current condition and behavior of salesperson related to visitation activity
Validate their pain point during the visitation activity
Gather their needs related to agent app
Respondent Criteria
2 CAOs (Customer Acquisition Officer) in Solo
2 CAOs in Pati
2 Salesperson in Magelang
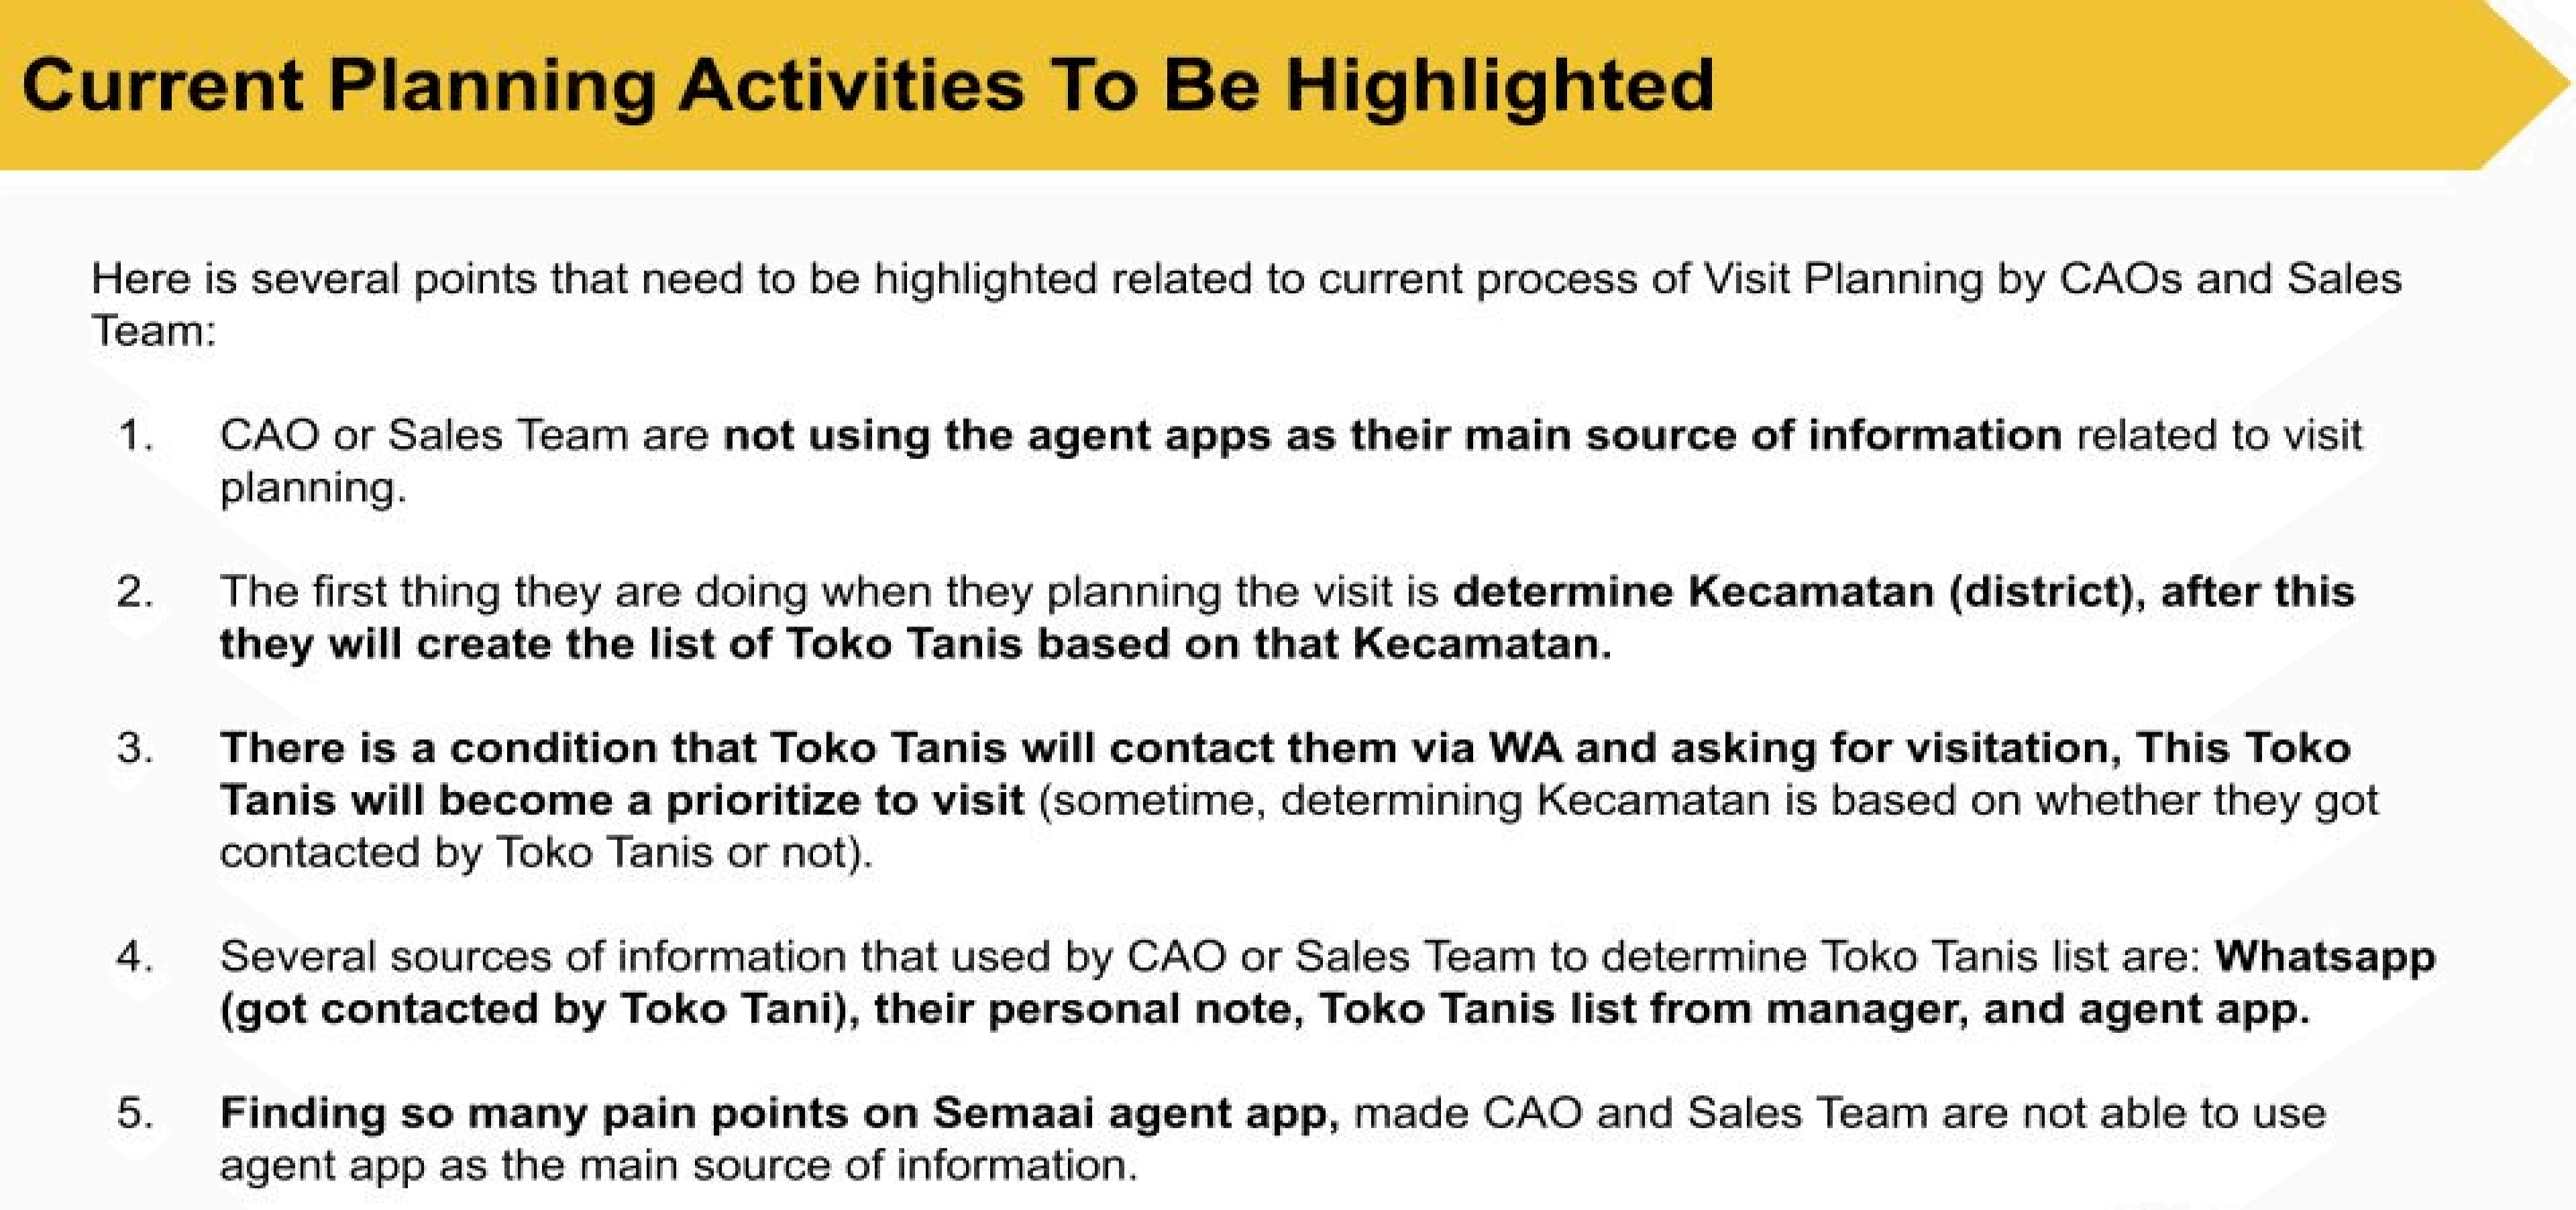
Image: Research results session with salesperson
We also want to know how did salesperson determine toko tani / customer they are going to visit, we have presented the data in chart form

Image: Research results session with salesperson
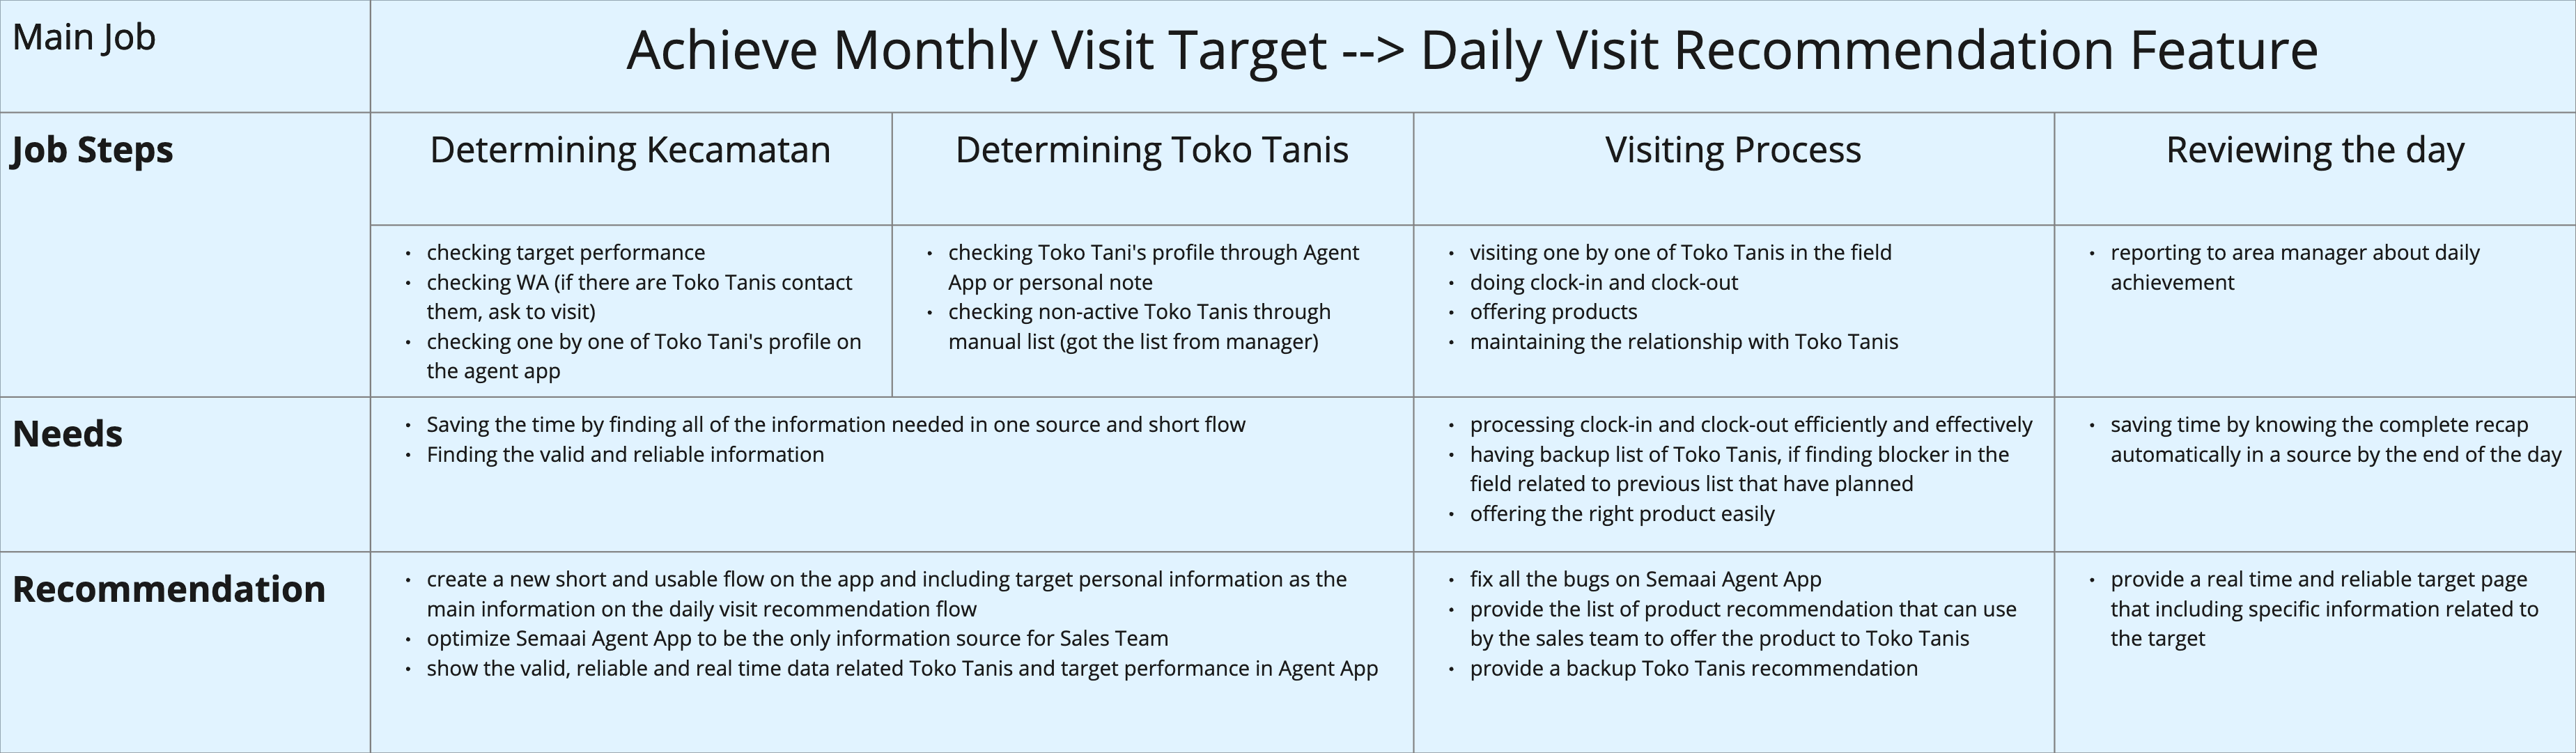
Jobs To Be Done
We determined the jobs to be done by salesperson when we wrap up research results, and we got a validation from our data in the beginning : confused to determine what toko tani they should visit is.

Image: Salesperson JTBD
Findings conclusion and action items
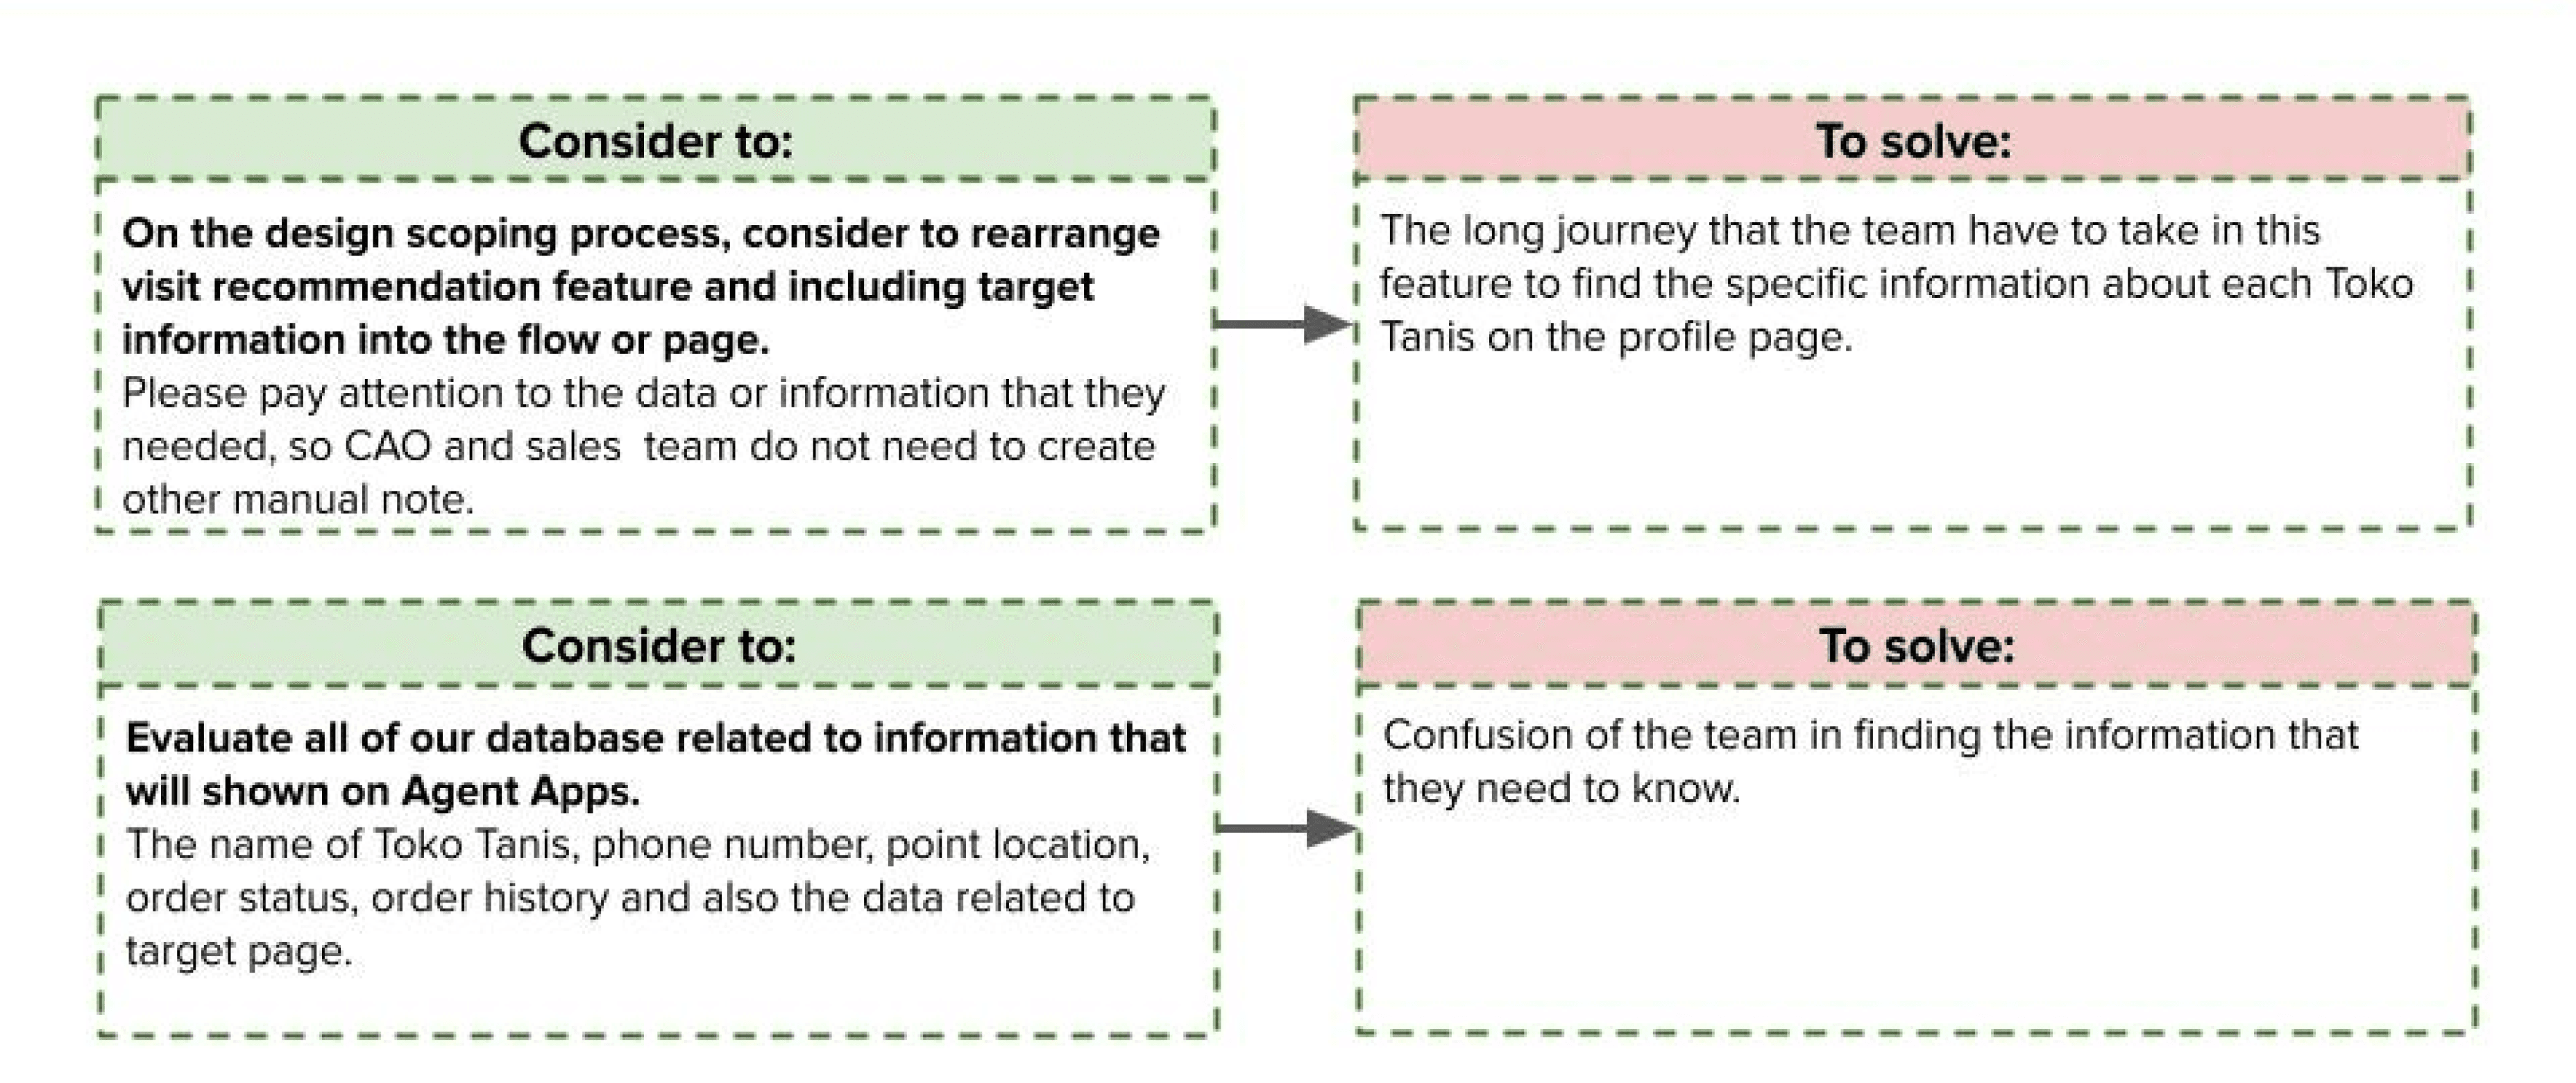
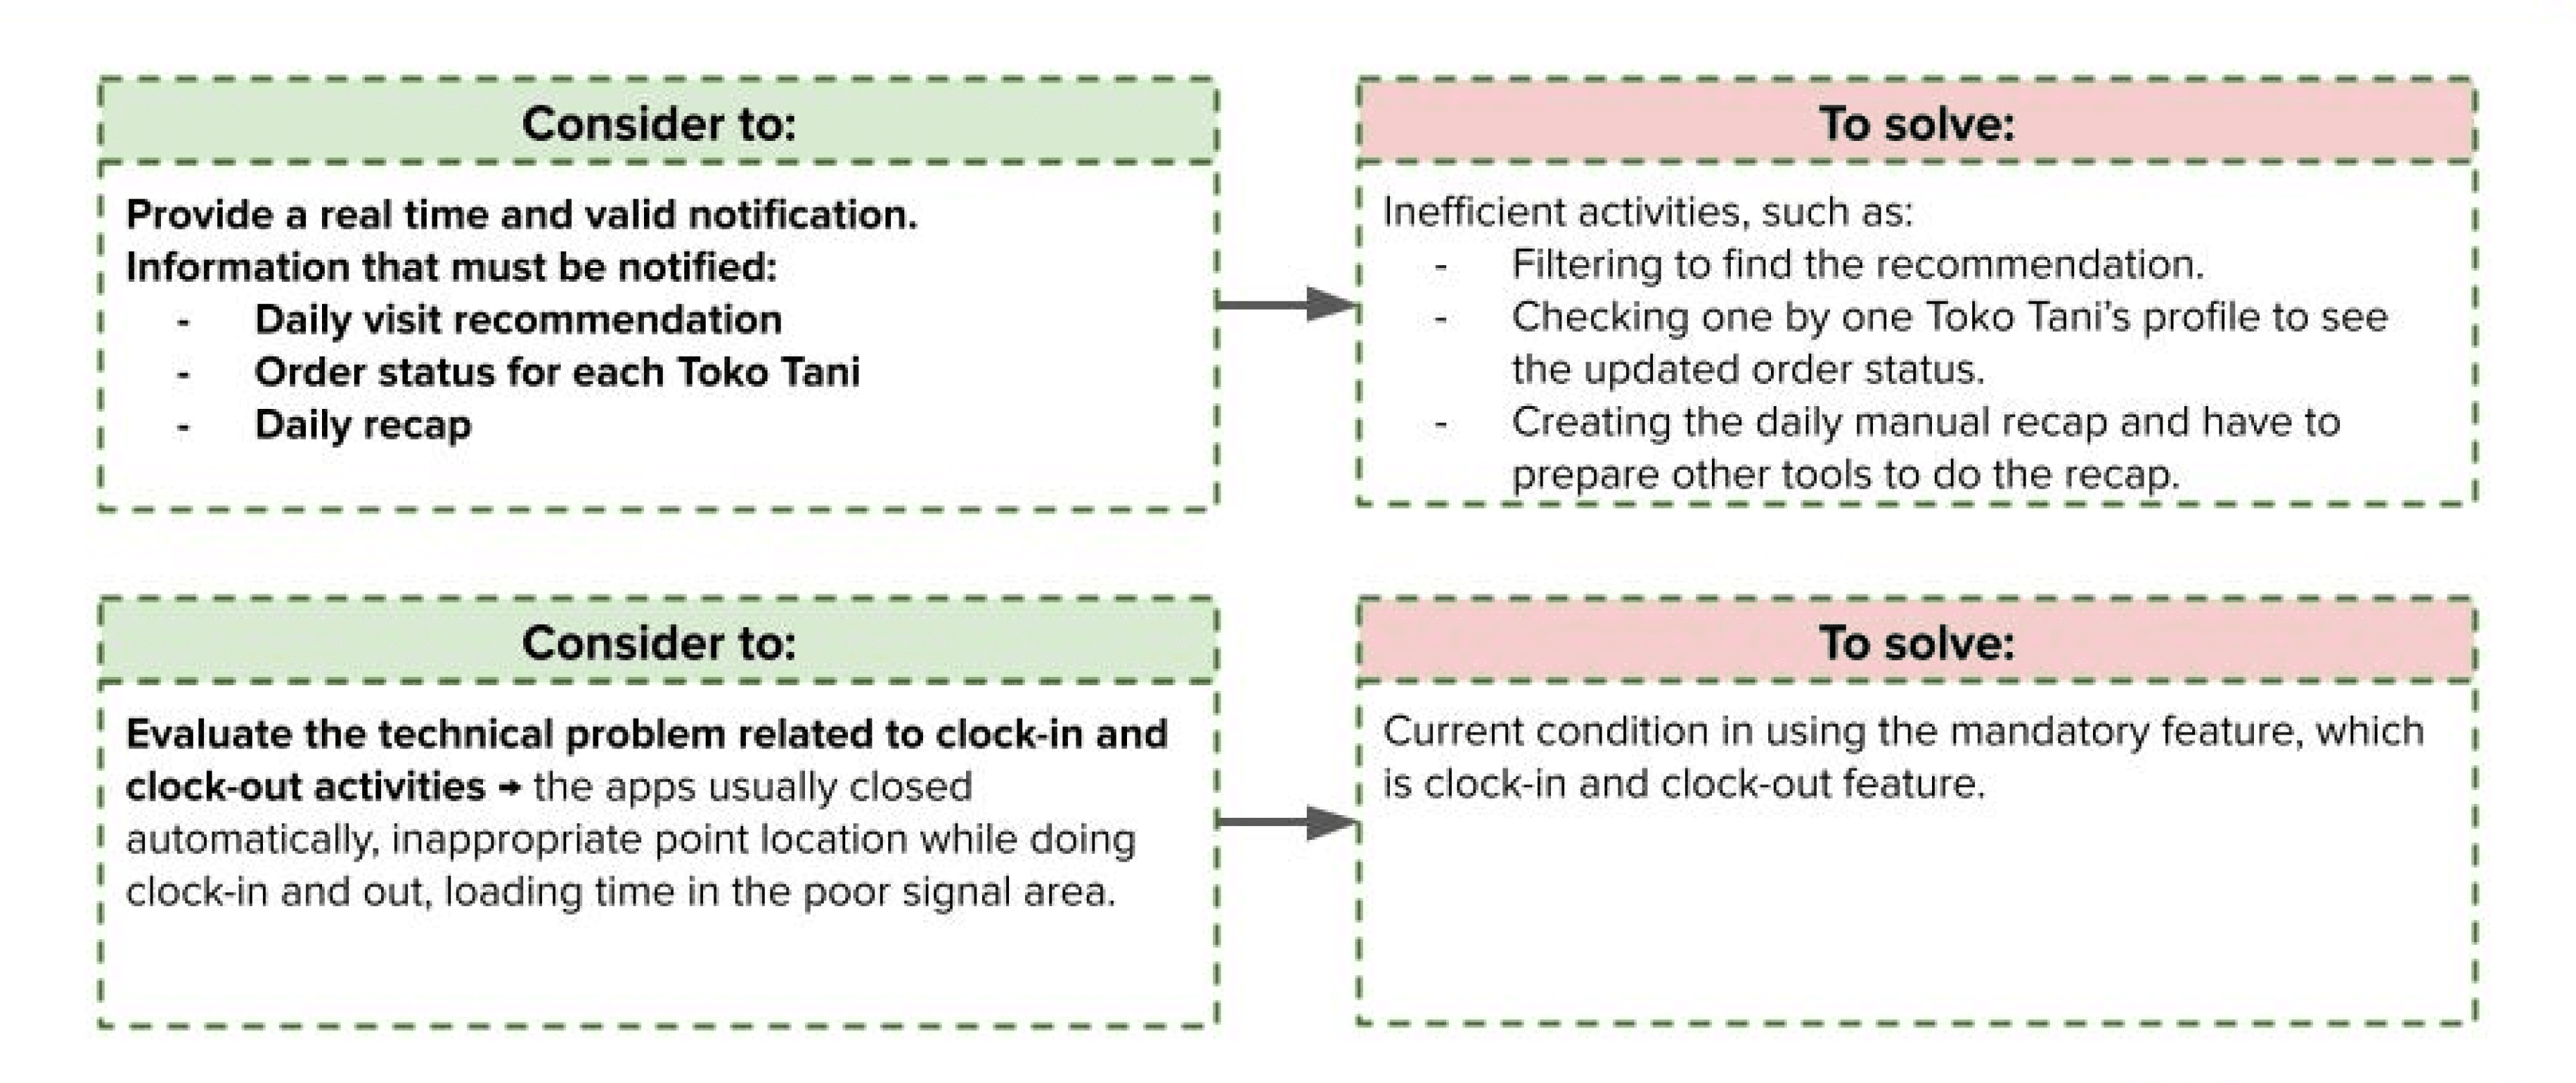
Define
After we have research results, we found several problems needs to be solved as soon as possible. We have to adopts salesperson mental model that has been formed based on the results of research reports, there is a job to be done to map out raw data into specific problem statement based on salesperson needs. As we know, salesperson has a target to achieve X amount of transaction and unique number of customer visit (how many different customer they visit in a month).
We are gonna aim this specific pains based on findings.
We start to execute all on those top priority, because it was concrete and real problem already and we confident it will solve major problems that face by Semaai sales team
Ideation & Low Fidelity Design Concept
New Homepage concept
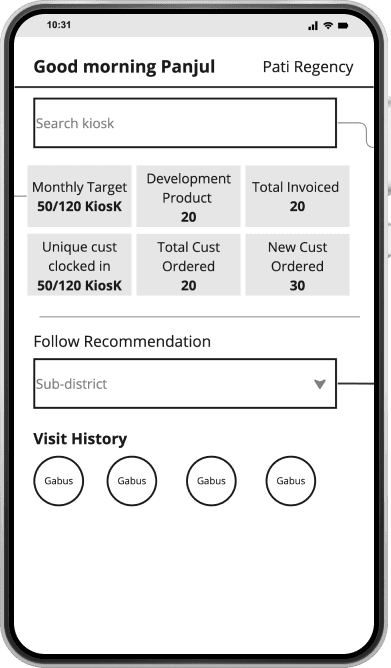
Performance glance for quick accessible
Shorten visit list flow
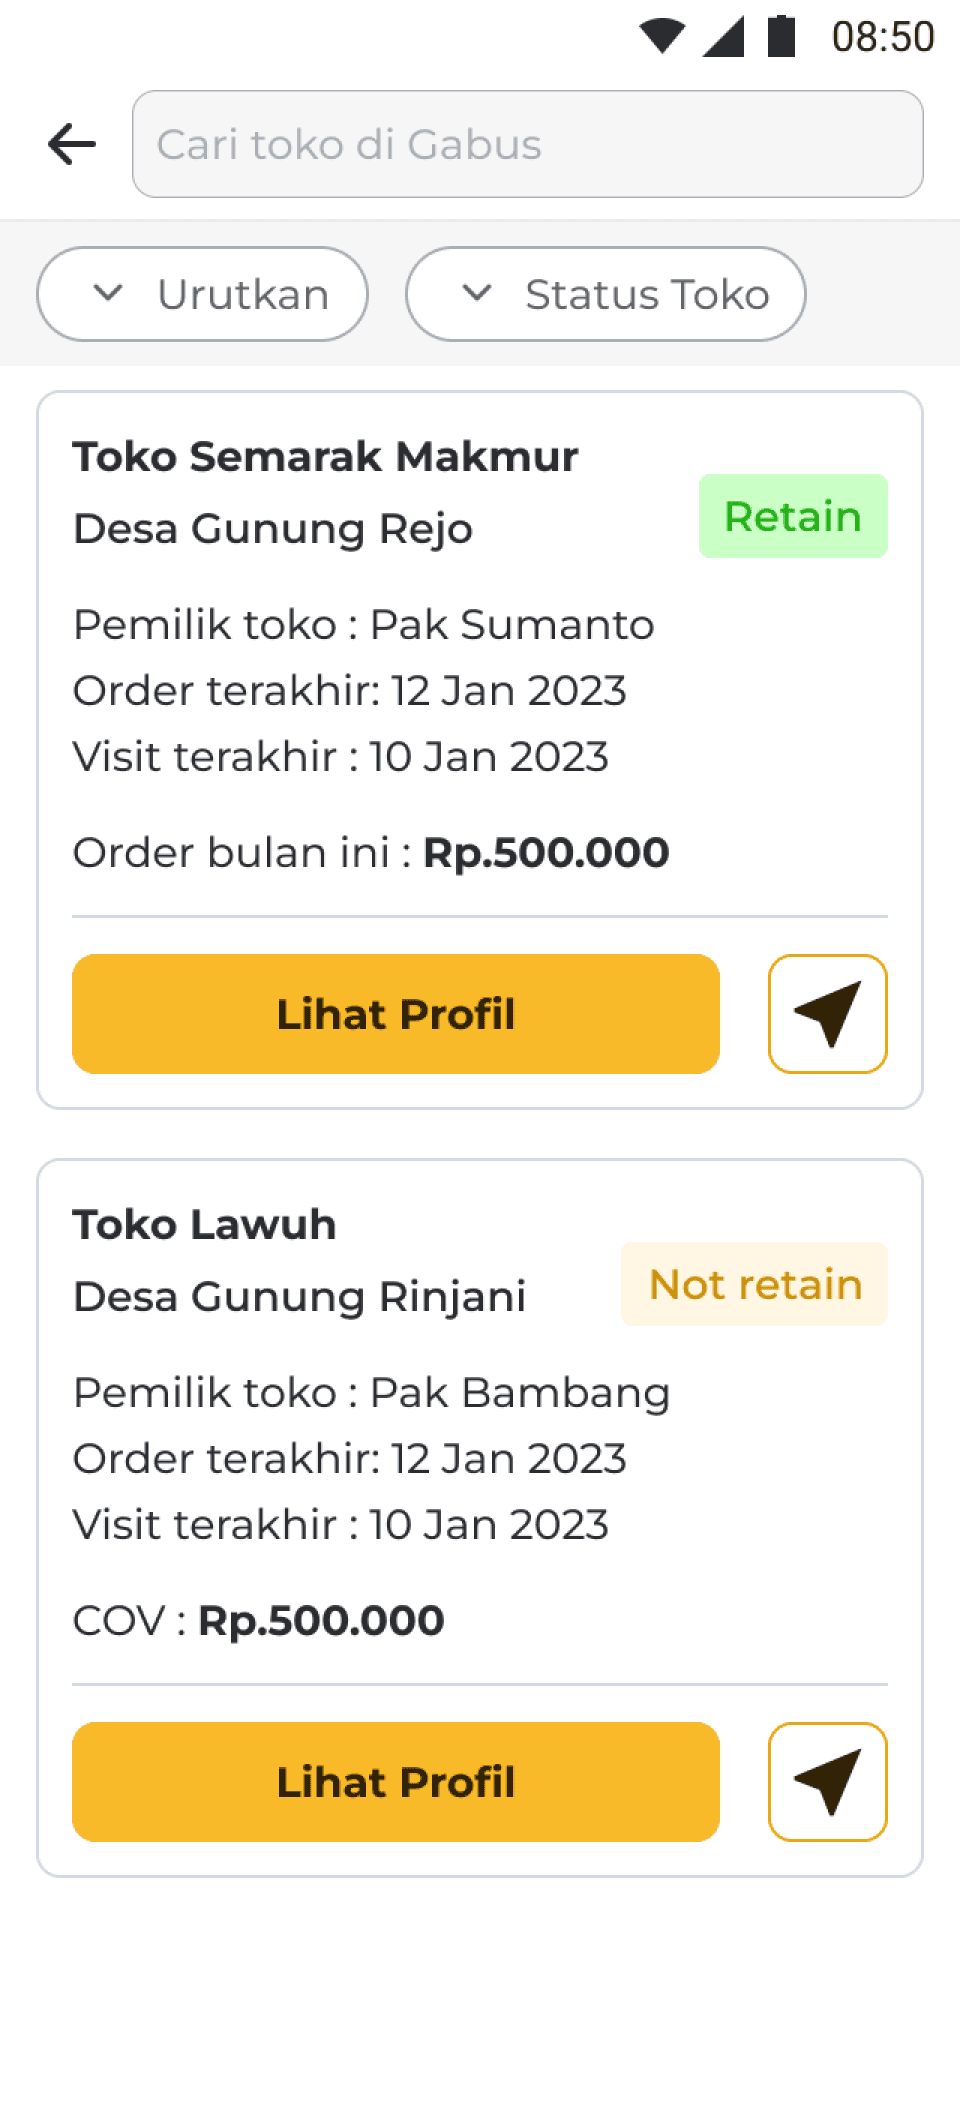
Visit list recommendation page
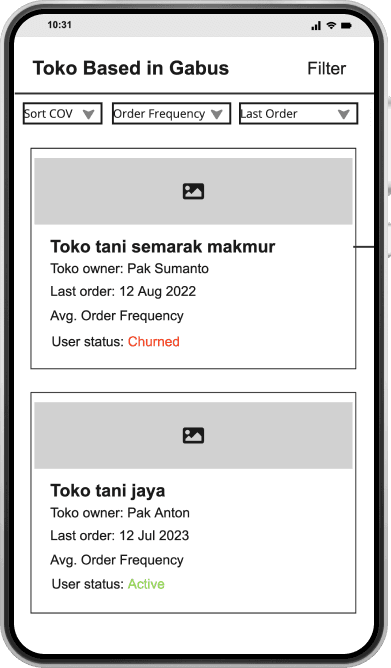
Toko tani store picture to ease scanning
Toko tani status based on user category, when was the last time they made a transaction. The one who hasn't made a transaction the longest will be positioned at the top
Sort and filter functionality
Customer profile page

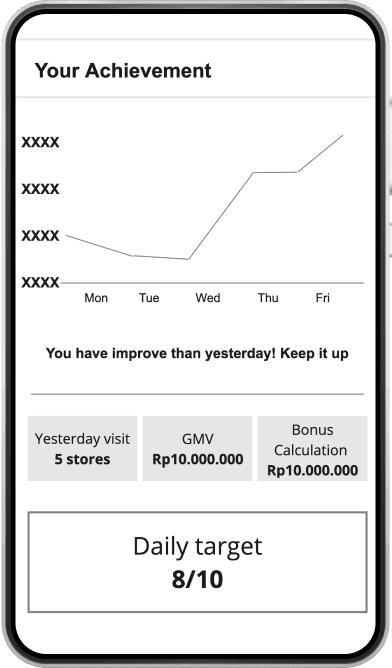
Performance dashboard page
Feedback and Learning from Early Concept
After presented the concept and discussed with several stakeholders and developers, we received feedback and constraint from tech capabilities, the points are :
We are not gonna showing kiosk photo
Showing visit history will add complexity and more logic in developing process. The impact itself is not commensurate with the effort
Customer profile page will be on the next separate focus project
We break apart the project into 3 sequences
For the first sprint, we were focus on redesigning homepage and performance dashboard
Second sprint was visit list recommendation flow
And the last sprint was customer satisfaction or customer profile page (Will be called CSAT feature later on)
Always communicate your intend and idea concept to every stakeholders who has business with your project, it will ease the process and give clarity how its going.
“Stakeholders management”
Design Interface Phase
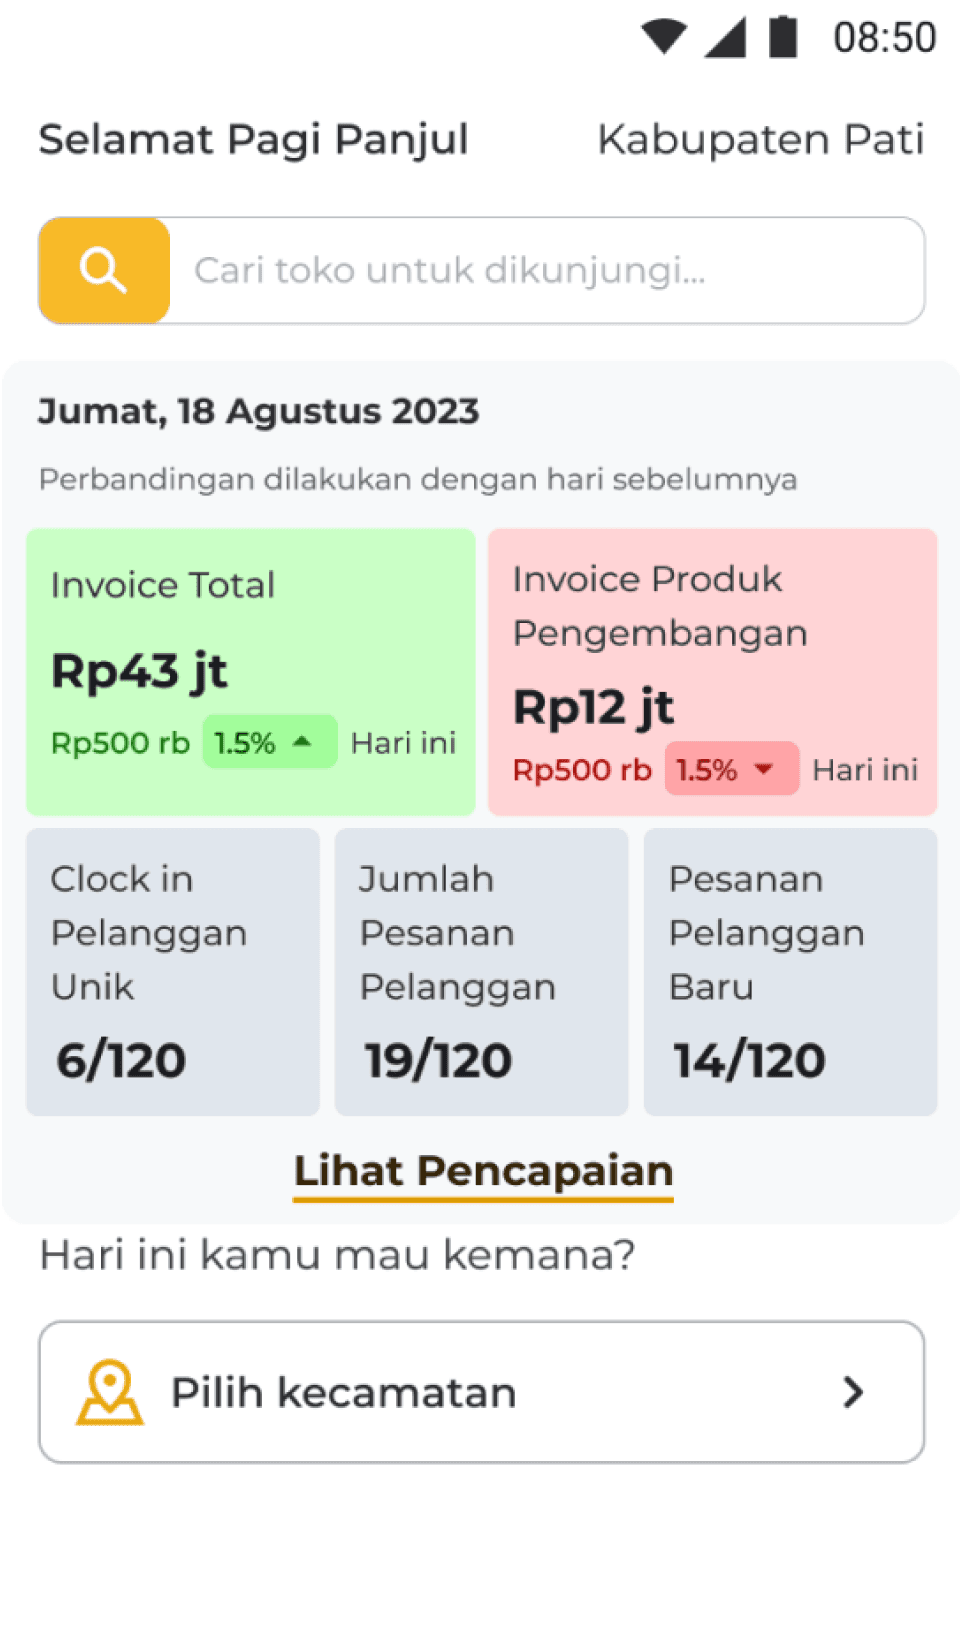
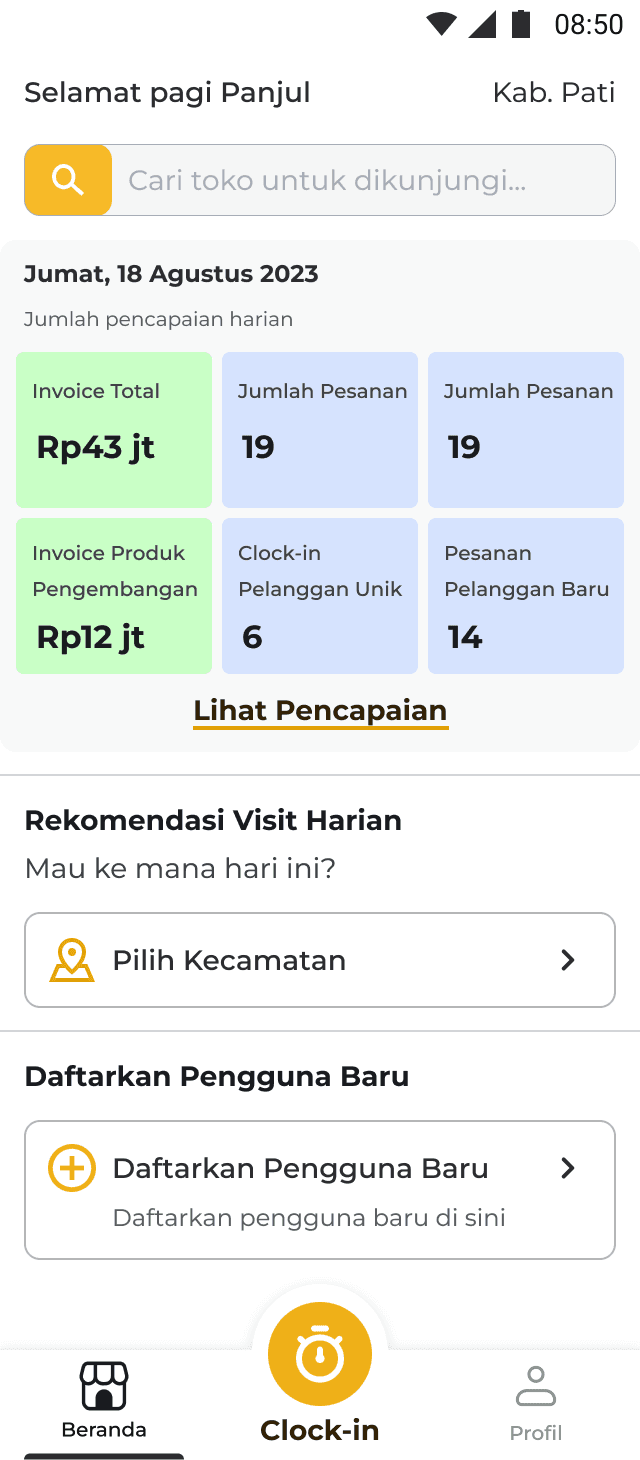
Homepage and performance dashboard new design
Achievement dashboard is on homepage, sales person can see directly their progress in daily basis, real time
They can access full information if they needed
Percentage is based on daily basis performance
The recommended visit list is a list of customers based on the sub-district filter distance.
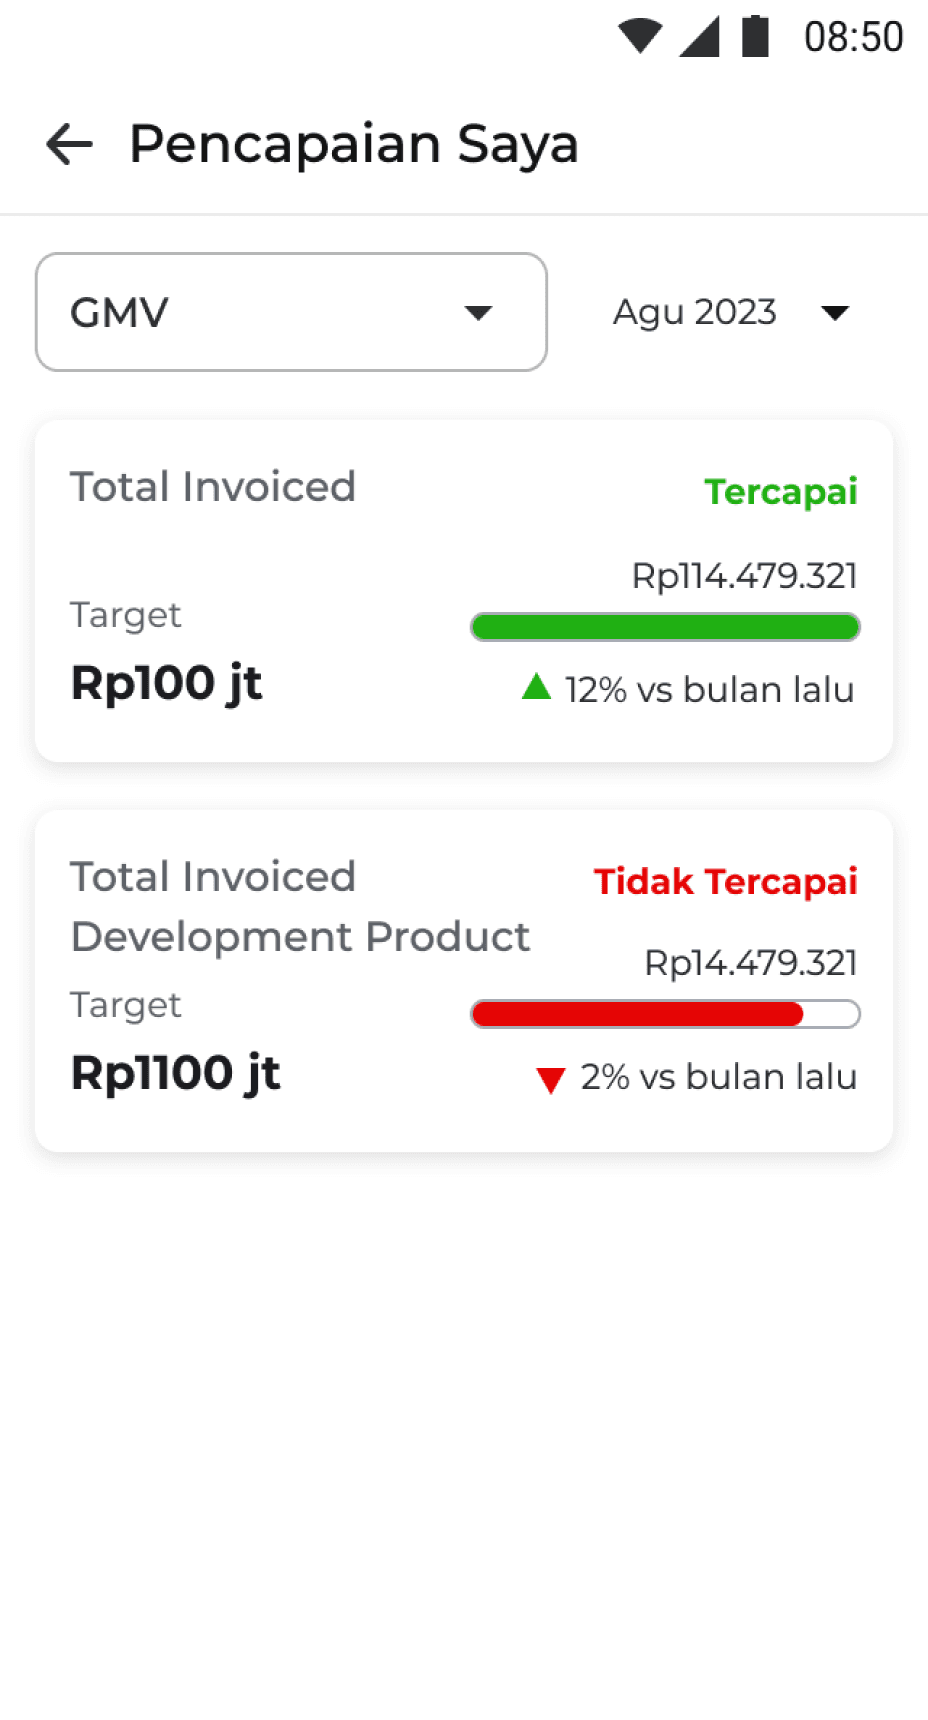
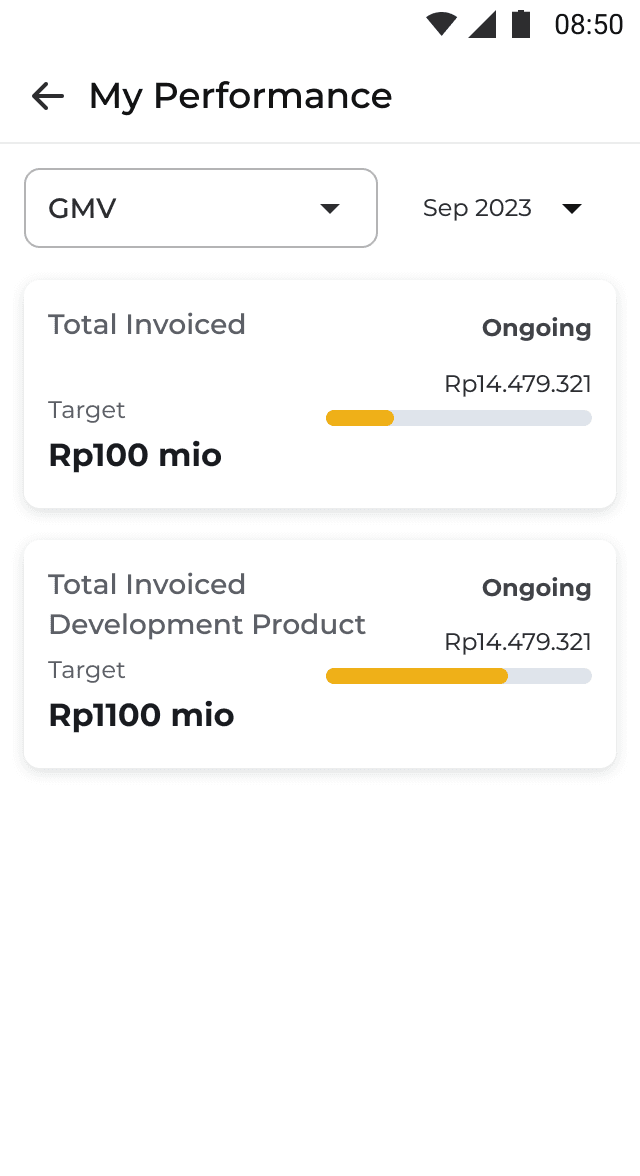
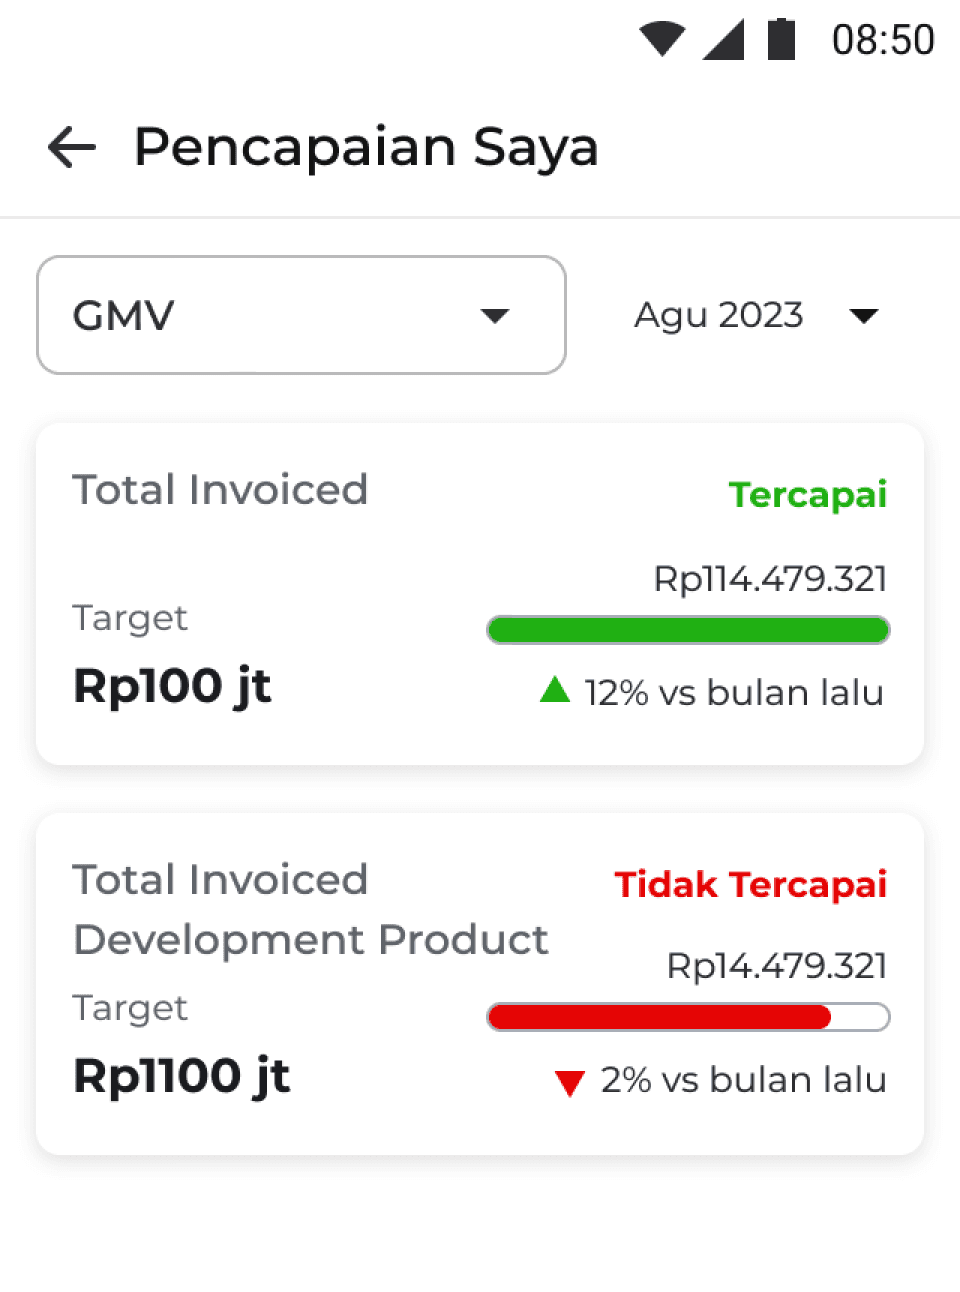
Performance dashboard (GMV) page new design and
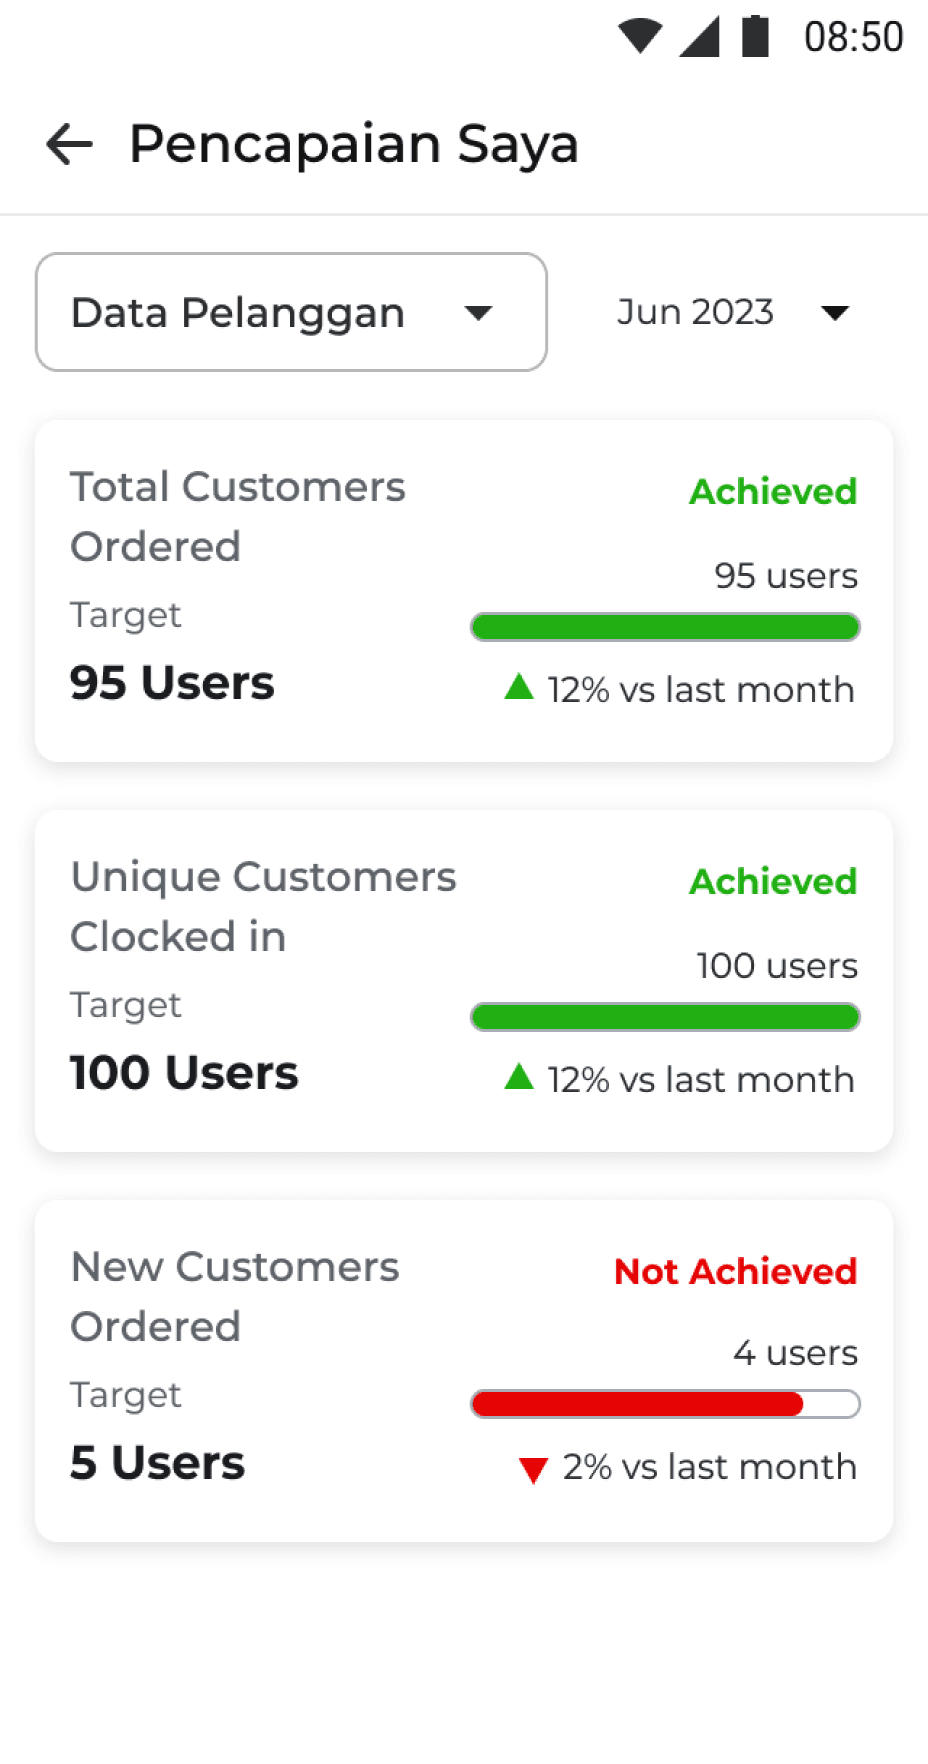
Performance dashboard (customer data) page new design
The performance dashboard is a collection of information about the sales team's achievements, they can access their performance information directly.
Customer data achievement insist with :
Total customer ordered
Unique customer clocked in is how many visits to different customers
New customers ordered
Performance dashboard is divided into 2 informations category
Gross Merchandise Value (GMV)
Customer Data (related to visit count)
Information that showing in this page is monthly basis data
Sales can see more detail what is happening by clicking on those category
There are status of achievement and progress bar.
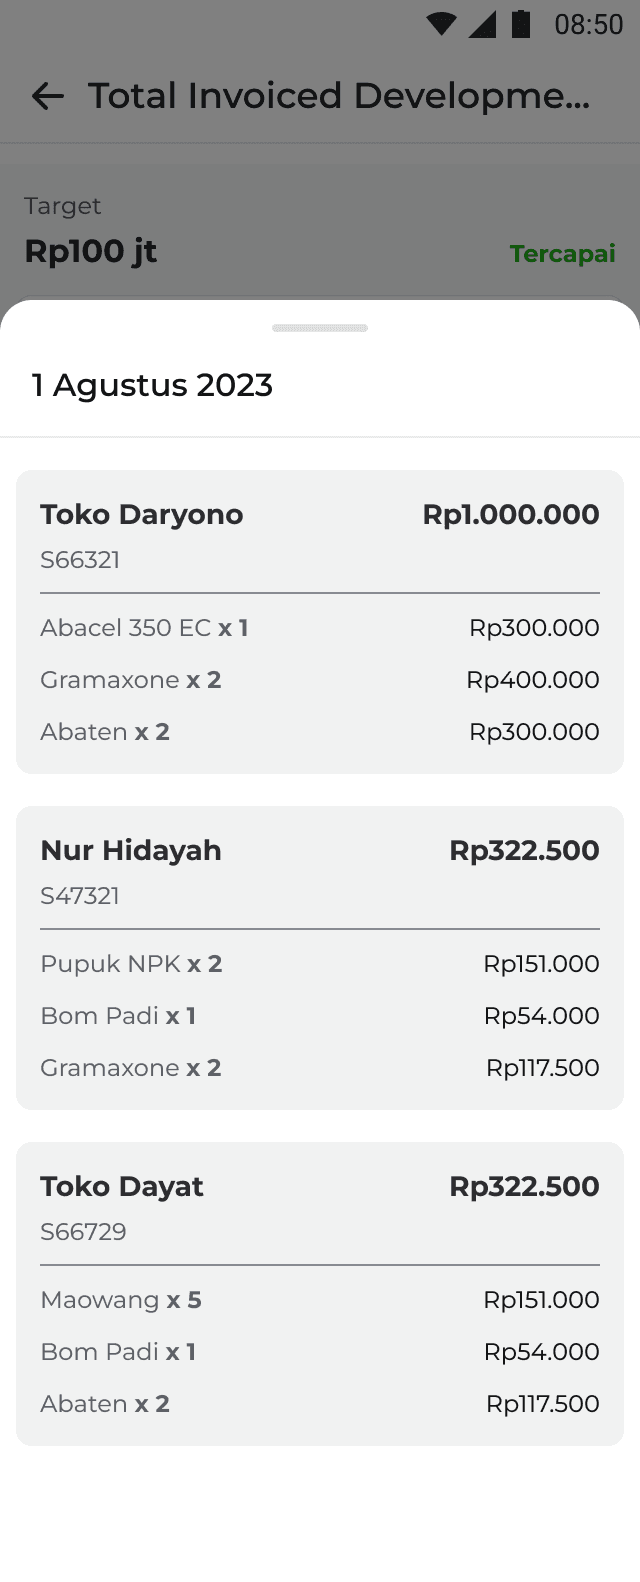
Performance Detail Information (GMV)
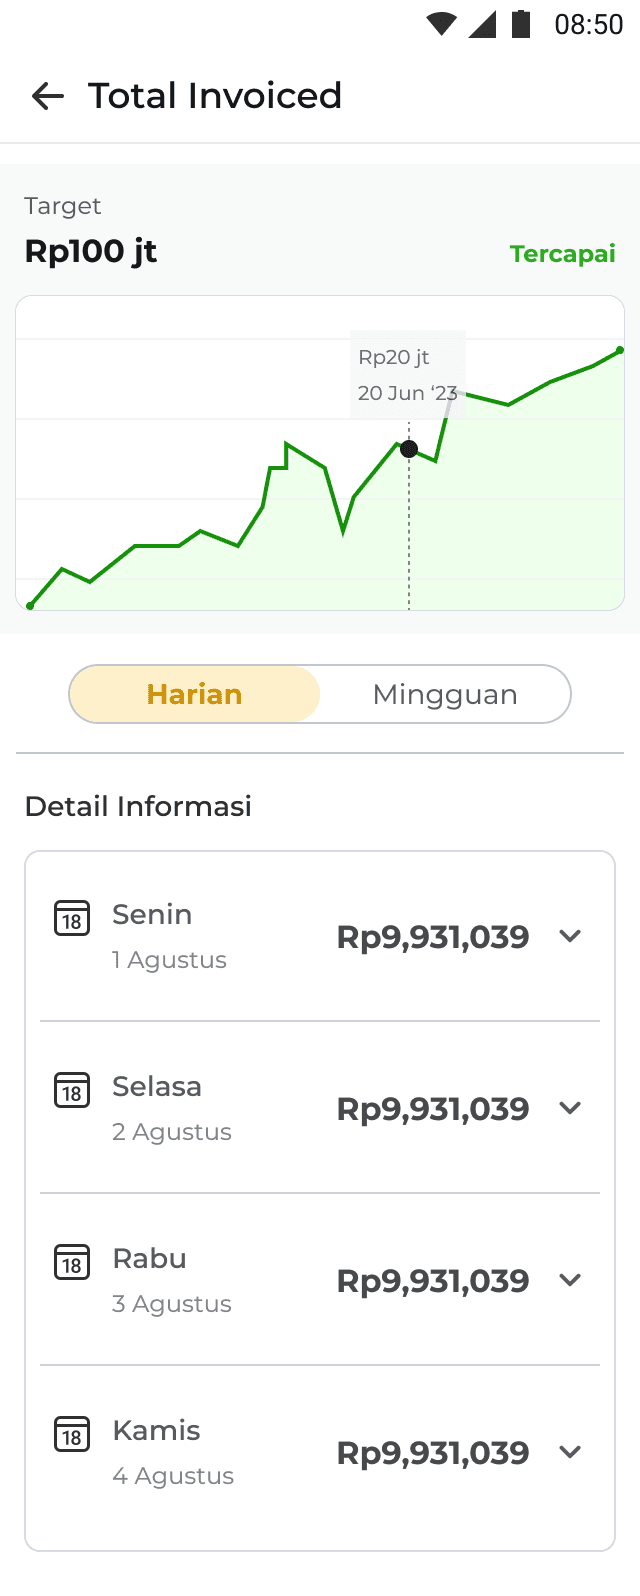
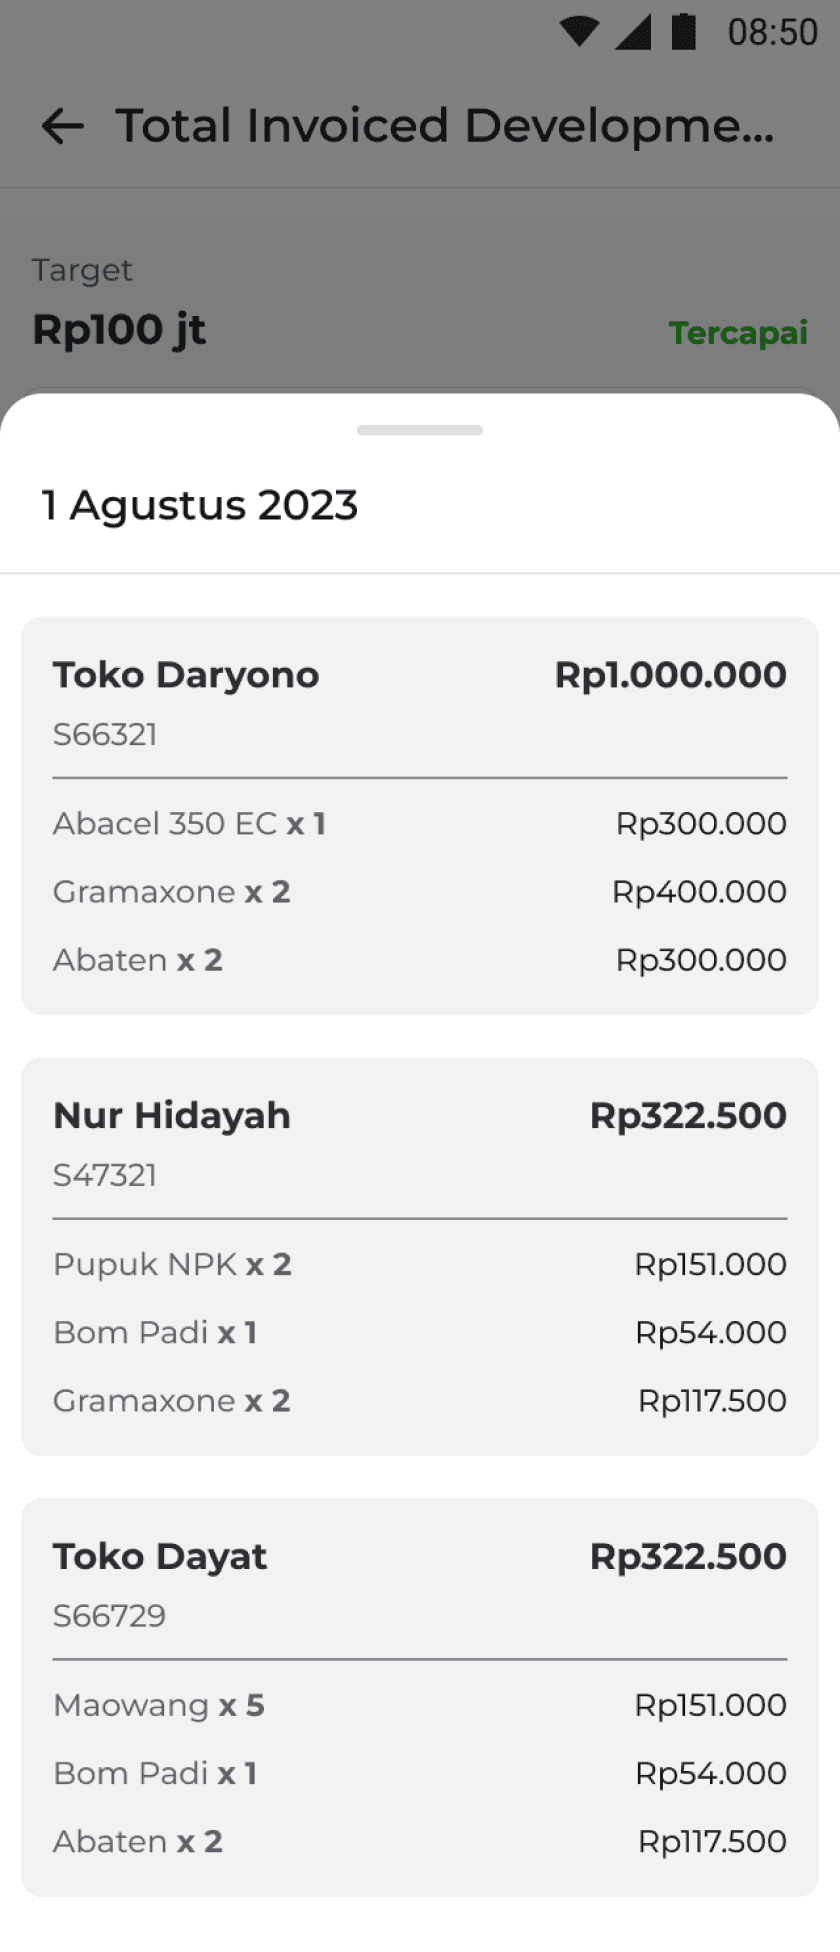
Daily basis data
Sales can see specific historical information on transactions that occurred on that date
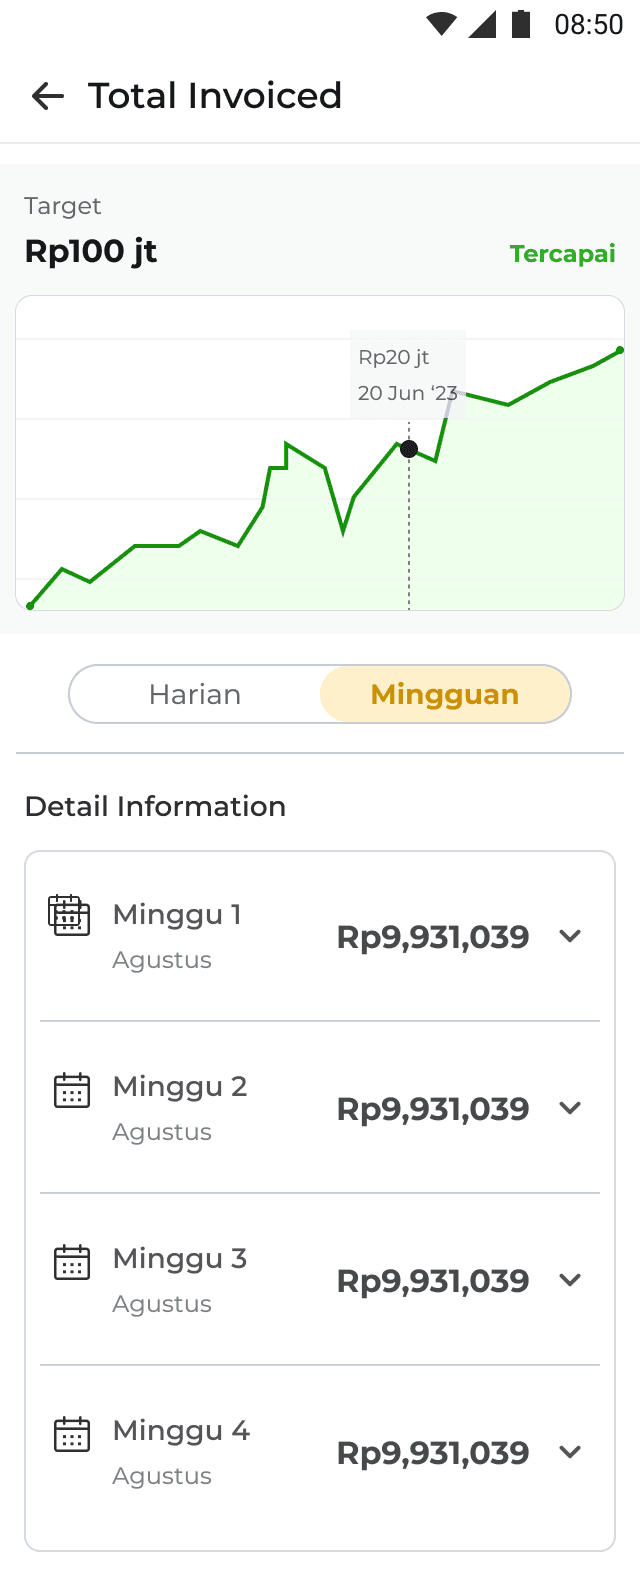

Weekly basis data
Using daily and weekly basis is completely based on sales needs. They need to track and retrospect how their performance and achievement
Performance Detail Information (Customer Data)
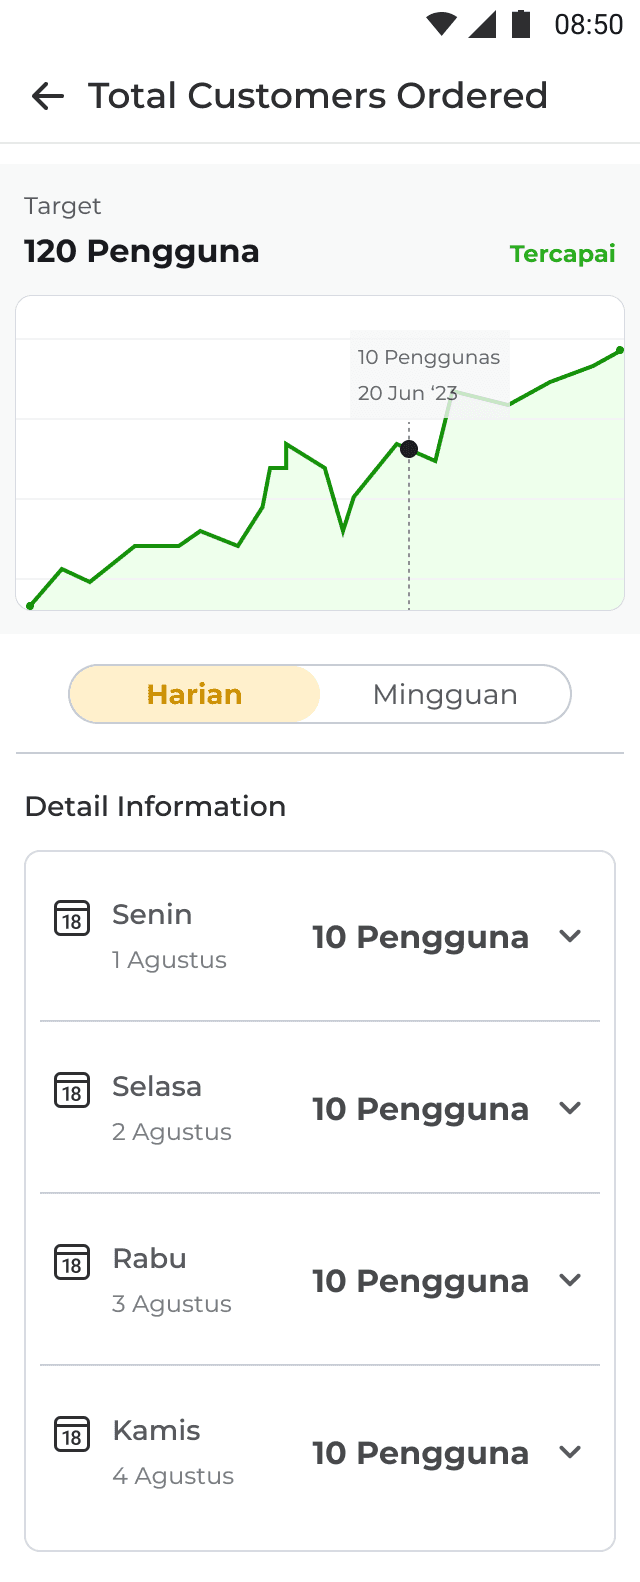
Daily basis data

Weekly basis data

Daily basis data

Weekly basis data
There’s a star icon to mark customer who did order on those range of time
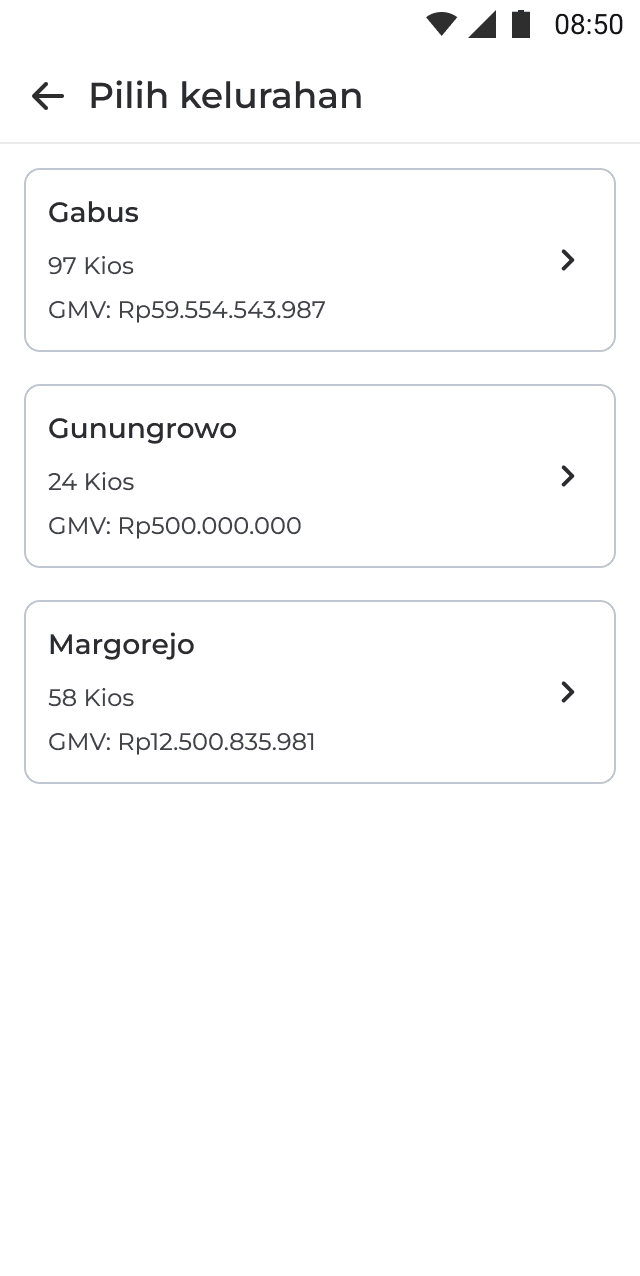
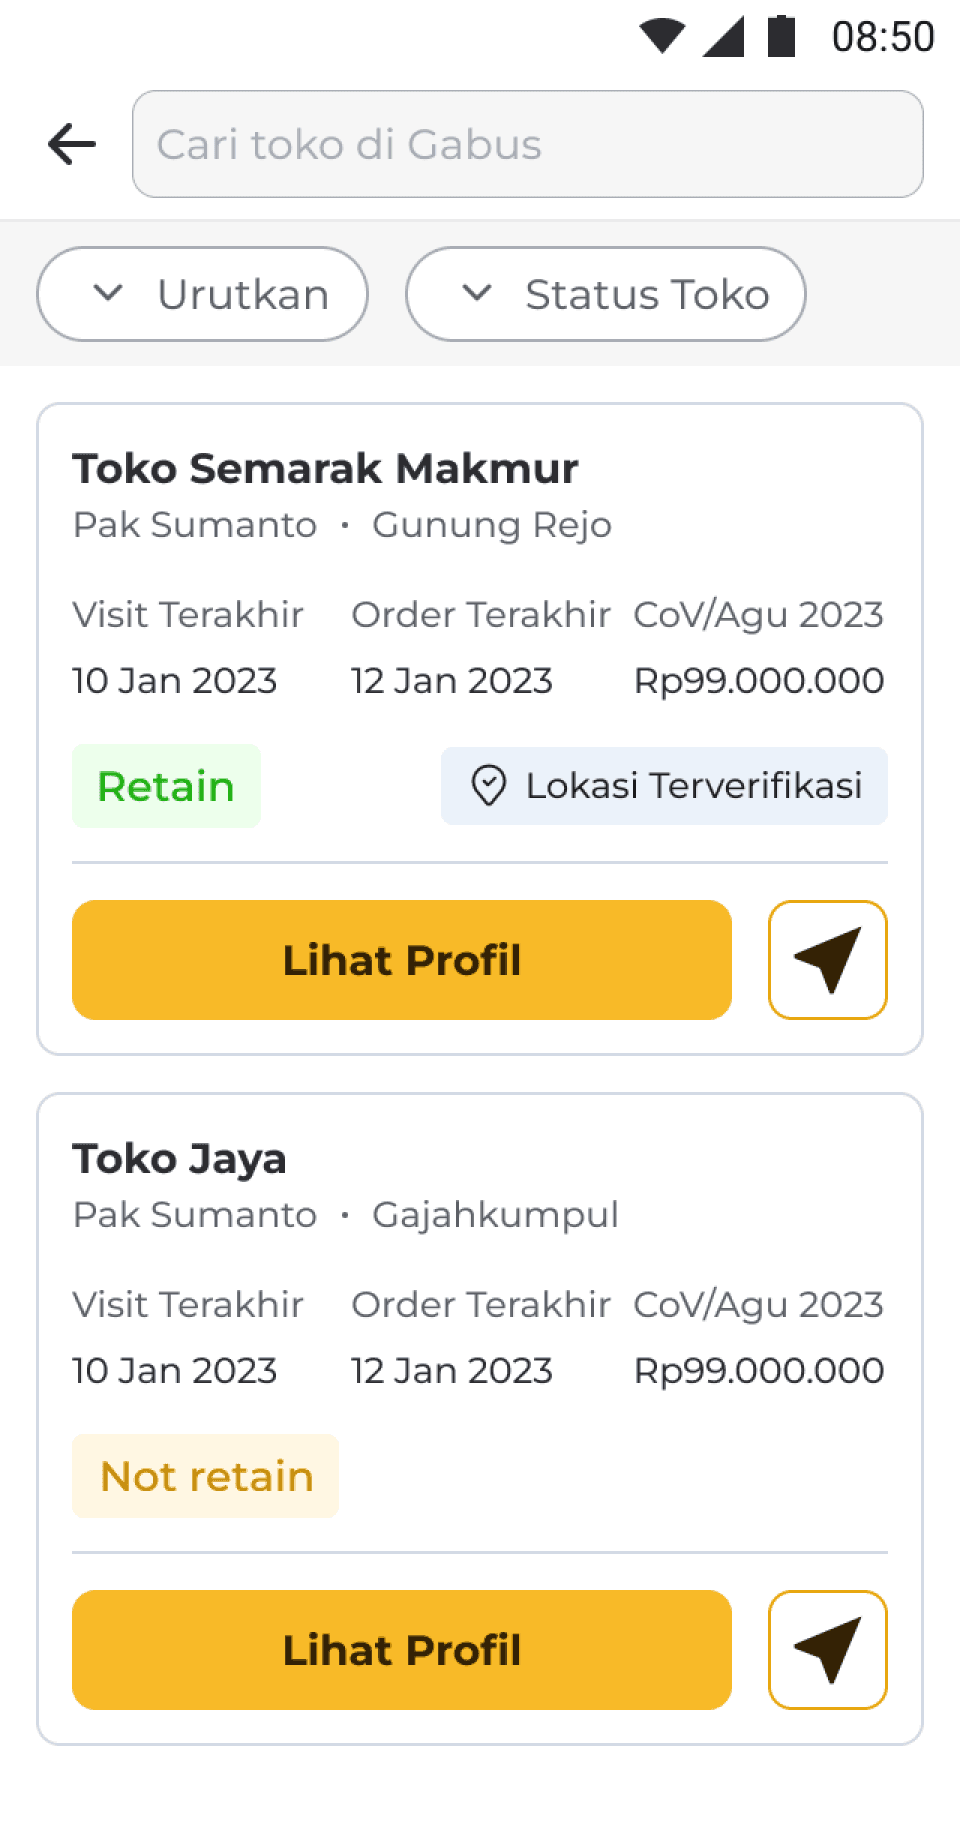
Daily visit Recommendation
We shorten user flow to access visit list recommendation
Visit list recommendation is based on sub-district, number of kiosk and GMV

New user is a user relative new registered and placing order <3 times
Retain is user doing routine order with Semaai
Not retain is user not placing order >1 month
Dormant is user not placing order >3 month
Churned is user uninstalling Semaai marketplace app
Edge Case
Ongoing status
Concept Testing
To make sure the solution is delivered right and acceptable, we test the design concept to sales team.
Participant:
Mas Wahyu, male, 30 years old, sales person
Pak Doni, male, 43 years old, sales person
Mas Sutanto, male, 38 years old, sales person

Testing summary
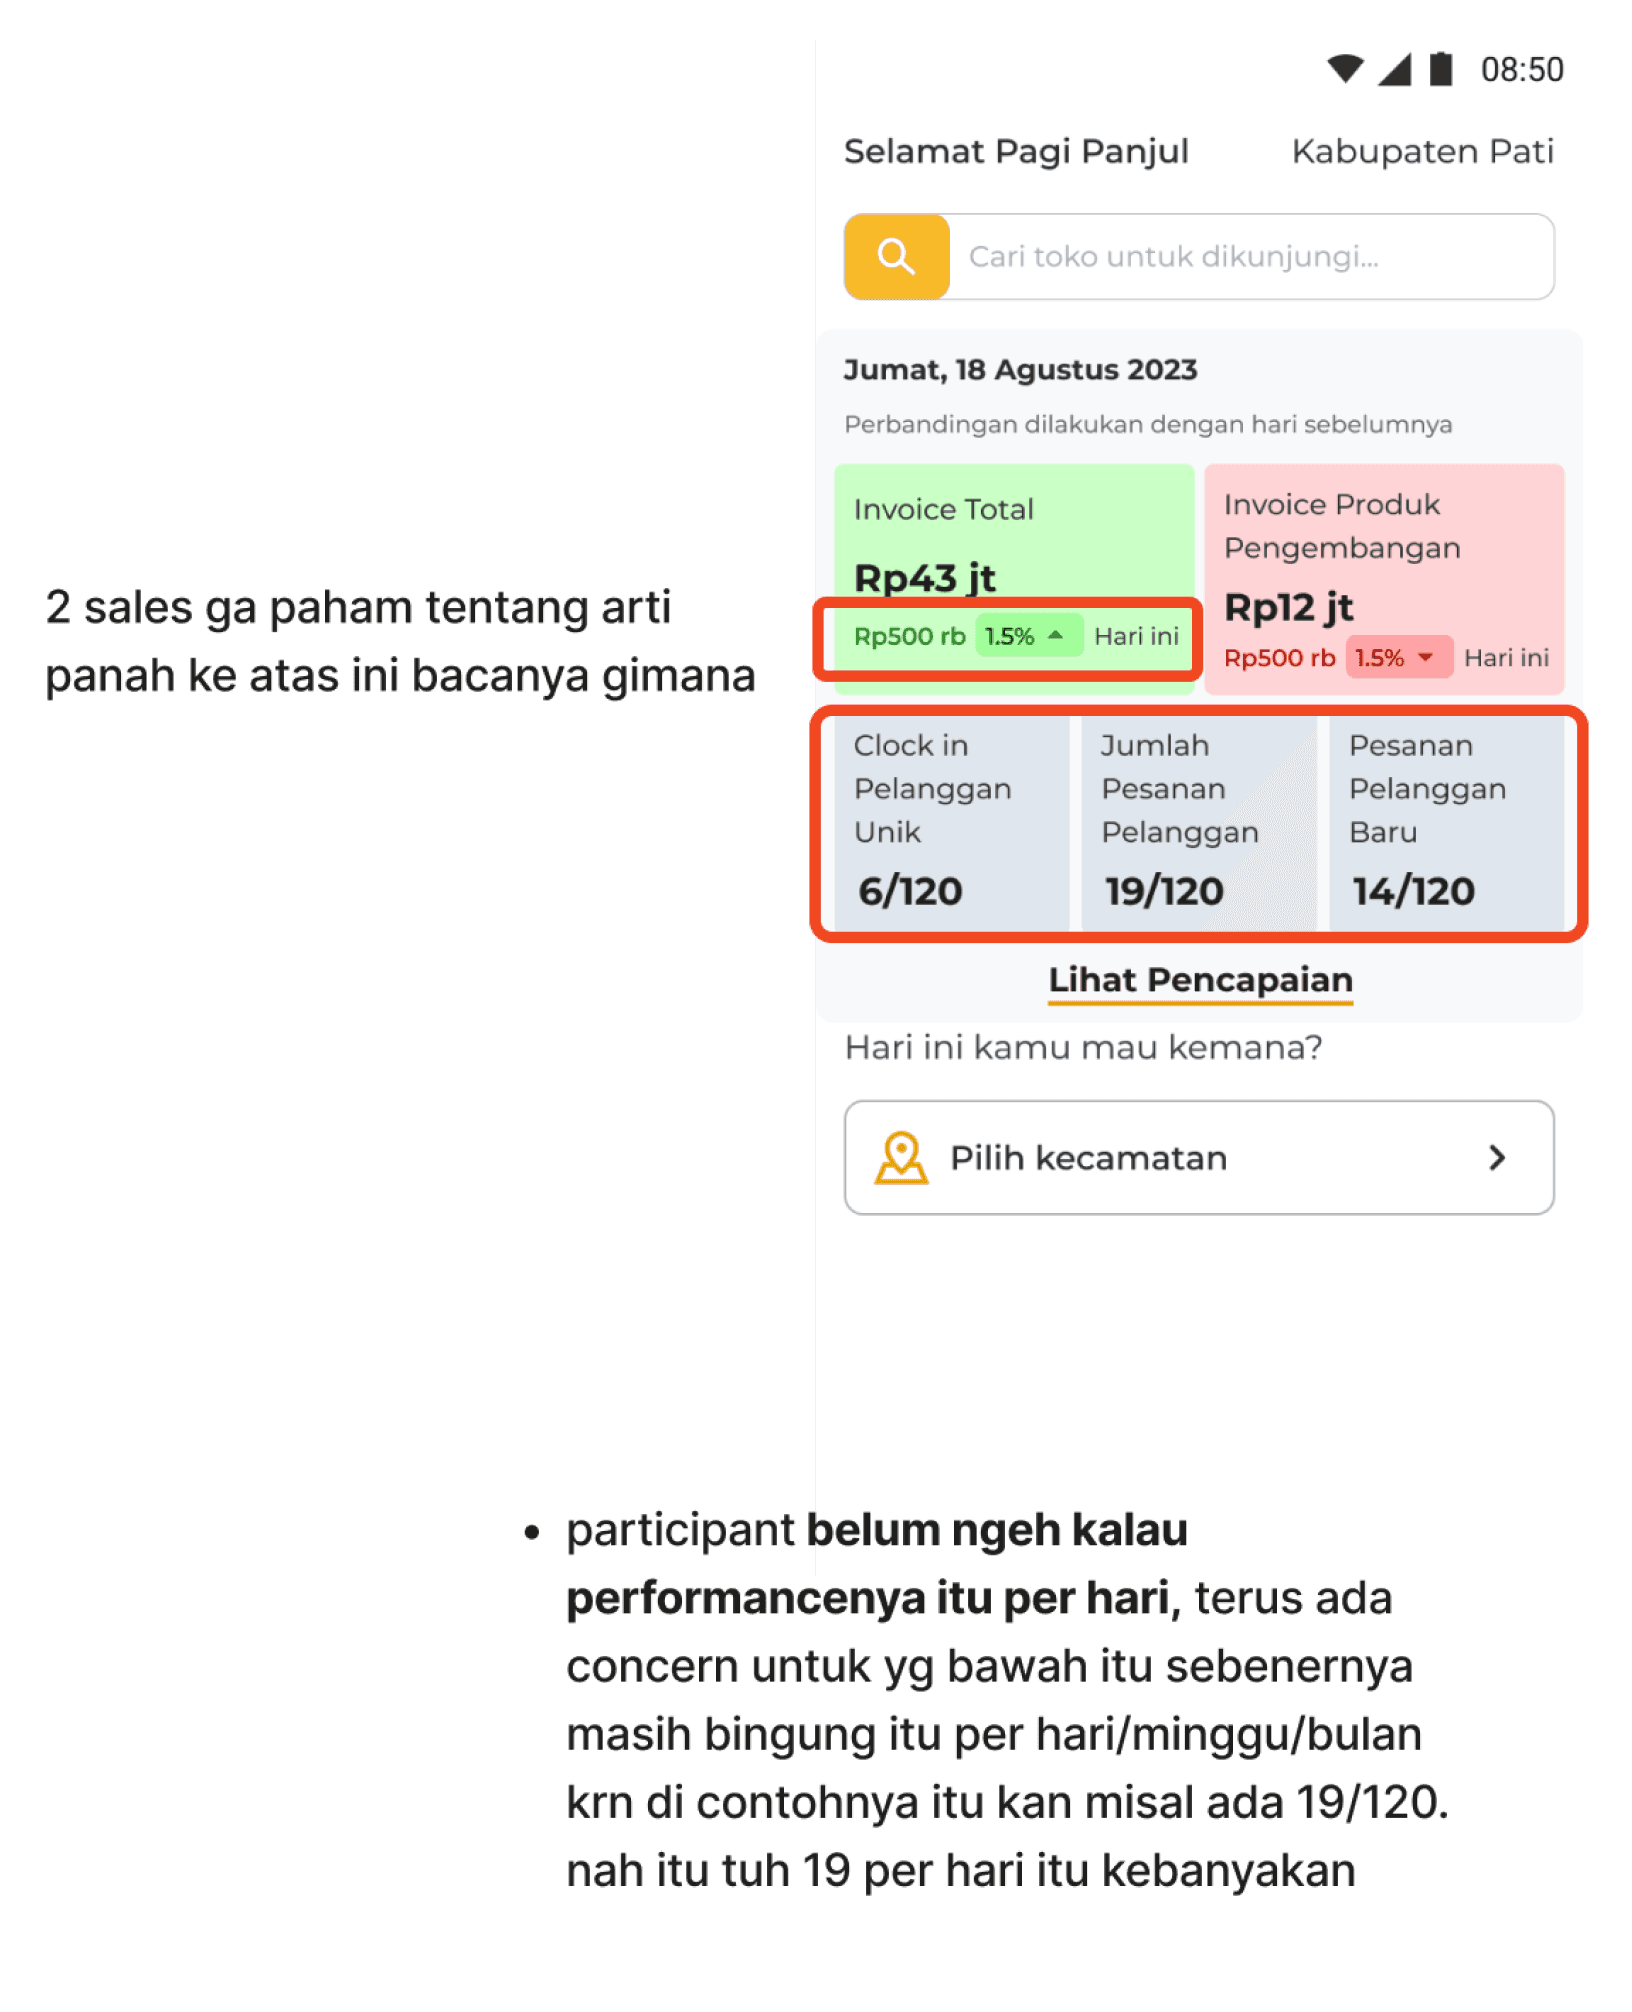
Two sales don't understand the meaning of the progress use for (performance)
Participation is not aware of the measured performance per day
Participants were also confused about what 19/120 and the others meant, whether per day, per month or per week, and according to them it was not relevant, they only needed data for this one day.
It's better not to have a button in the visit list recommendation section, because if there are too many interactions with the application it will be burdensome application
On the performance dashboard page, the number displayed should be a exact number
On the detailed information page, usually if you want to see shop transaction information, we first go to the shop page, but if it is abbreviated like this, the flow will be better and faster, but it takes time to get used to it
There are several shops whose locations do not match on the maps, so it would be best to verify them
Design Iteration and Finalization
Based on feedback and concept testing results, here are our actionable item with design :
In homepage:
Remove progress percentage from homepage performance dashboard
Showing unique clocked in data only on per daily basis, not by monthly target
In visit list recommendation:
Showing last month GMV and compare to ongoing month GMV
Number of kiosk in sub-district
Add sort functionality with lowest to highest has auto applied
Verified kiosk location on visit list
Homepage and visit list recommendation

Performance Dashboard (GMV)
Performance Dashboard (Customer Data)

Edge Cases


Learnings
I’ve learned so much insights from this project regarding sales team activity, project prioritization, and deep empathy to sales person. Here are summary of my learning:
Understanding sales team behavior using field agent app and their pain points
Design advocate and UX audit process. In the beginning of process, we pointed out every possible UX broken, build hypothesis and we validated trough UX research with sales person
During the design process, there are many discussions and concept presentations carried out to get the best feedback and input so that the delivered design can be accepted
Testing is a must, we have to test the concept to end user before it wil be build / develop. We have to make sure propose ideation meets user needs. Its better to think, analyze and aim the correct problem instead of fast but nothing.
User centered design
Thanks for reading
Check my other projects
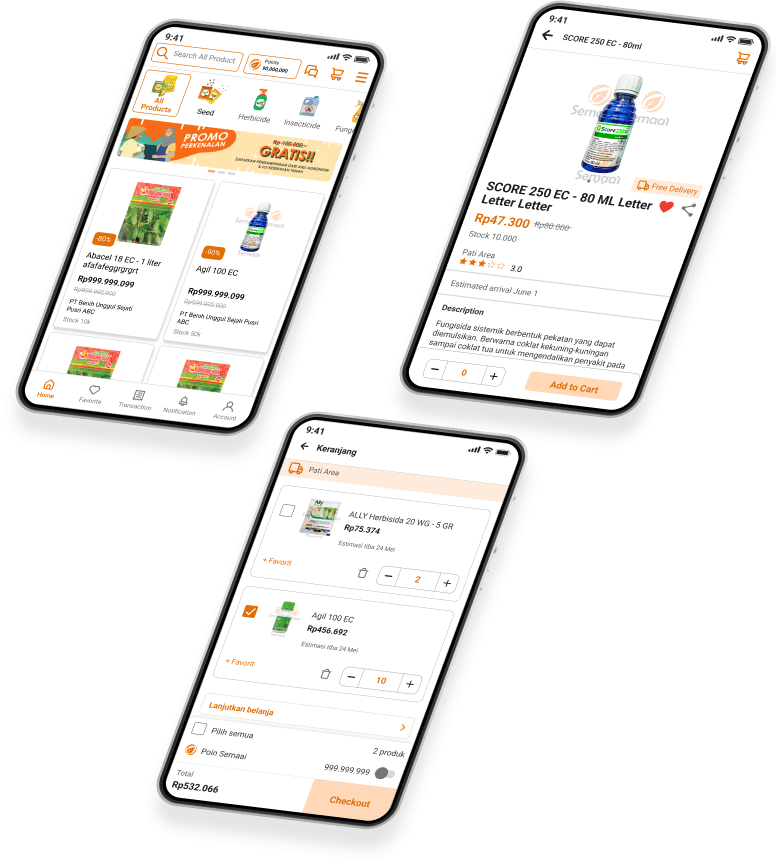
Semaai marketplace application (MVP v1.0)
Semaai is full stack solution for Indonesian farmers and agri MSMEs with operations area is in rural area with a mission to uplift the livelihood and income of 55 million farmers in Indonesia through a highly trusted network of MSMEs (Toko Tanis) and farmer groups through digital B2B marketplace.
Timeline
Q1 2022
Read case study
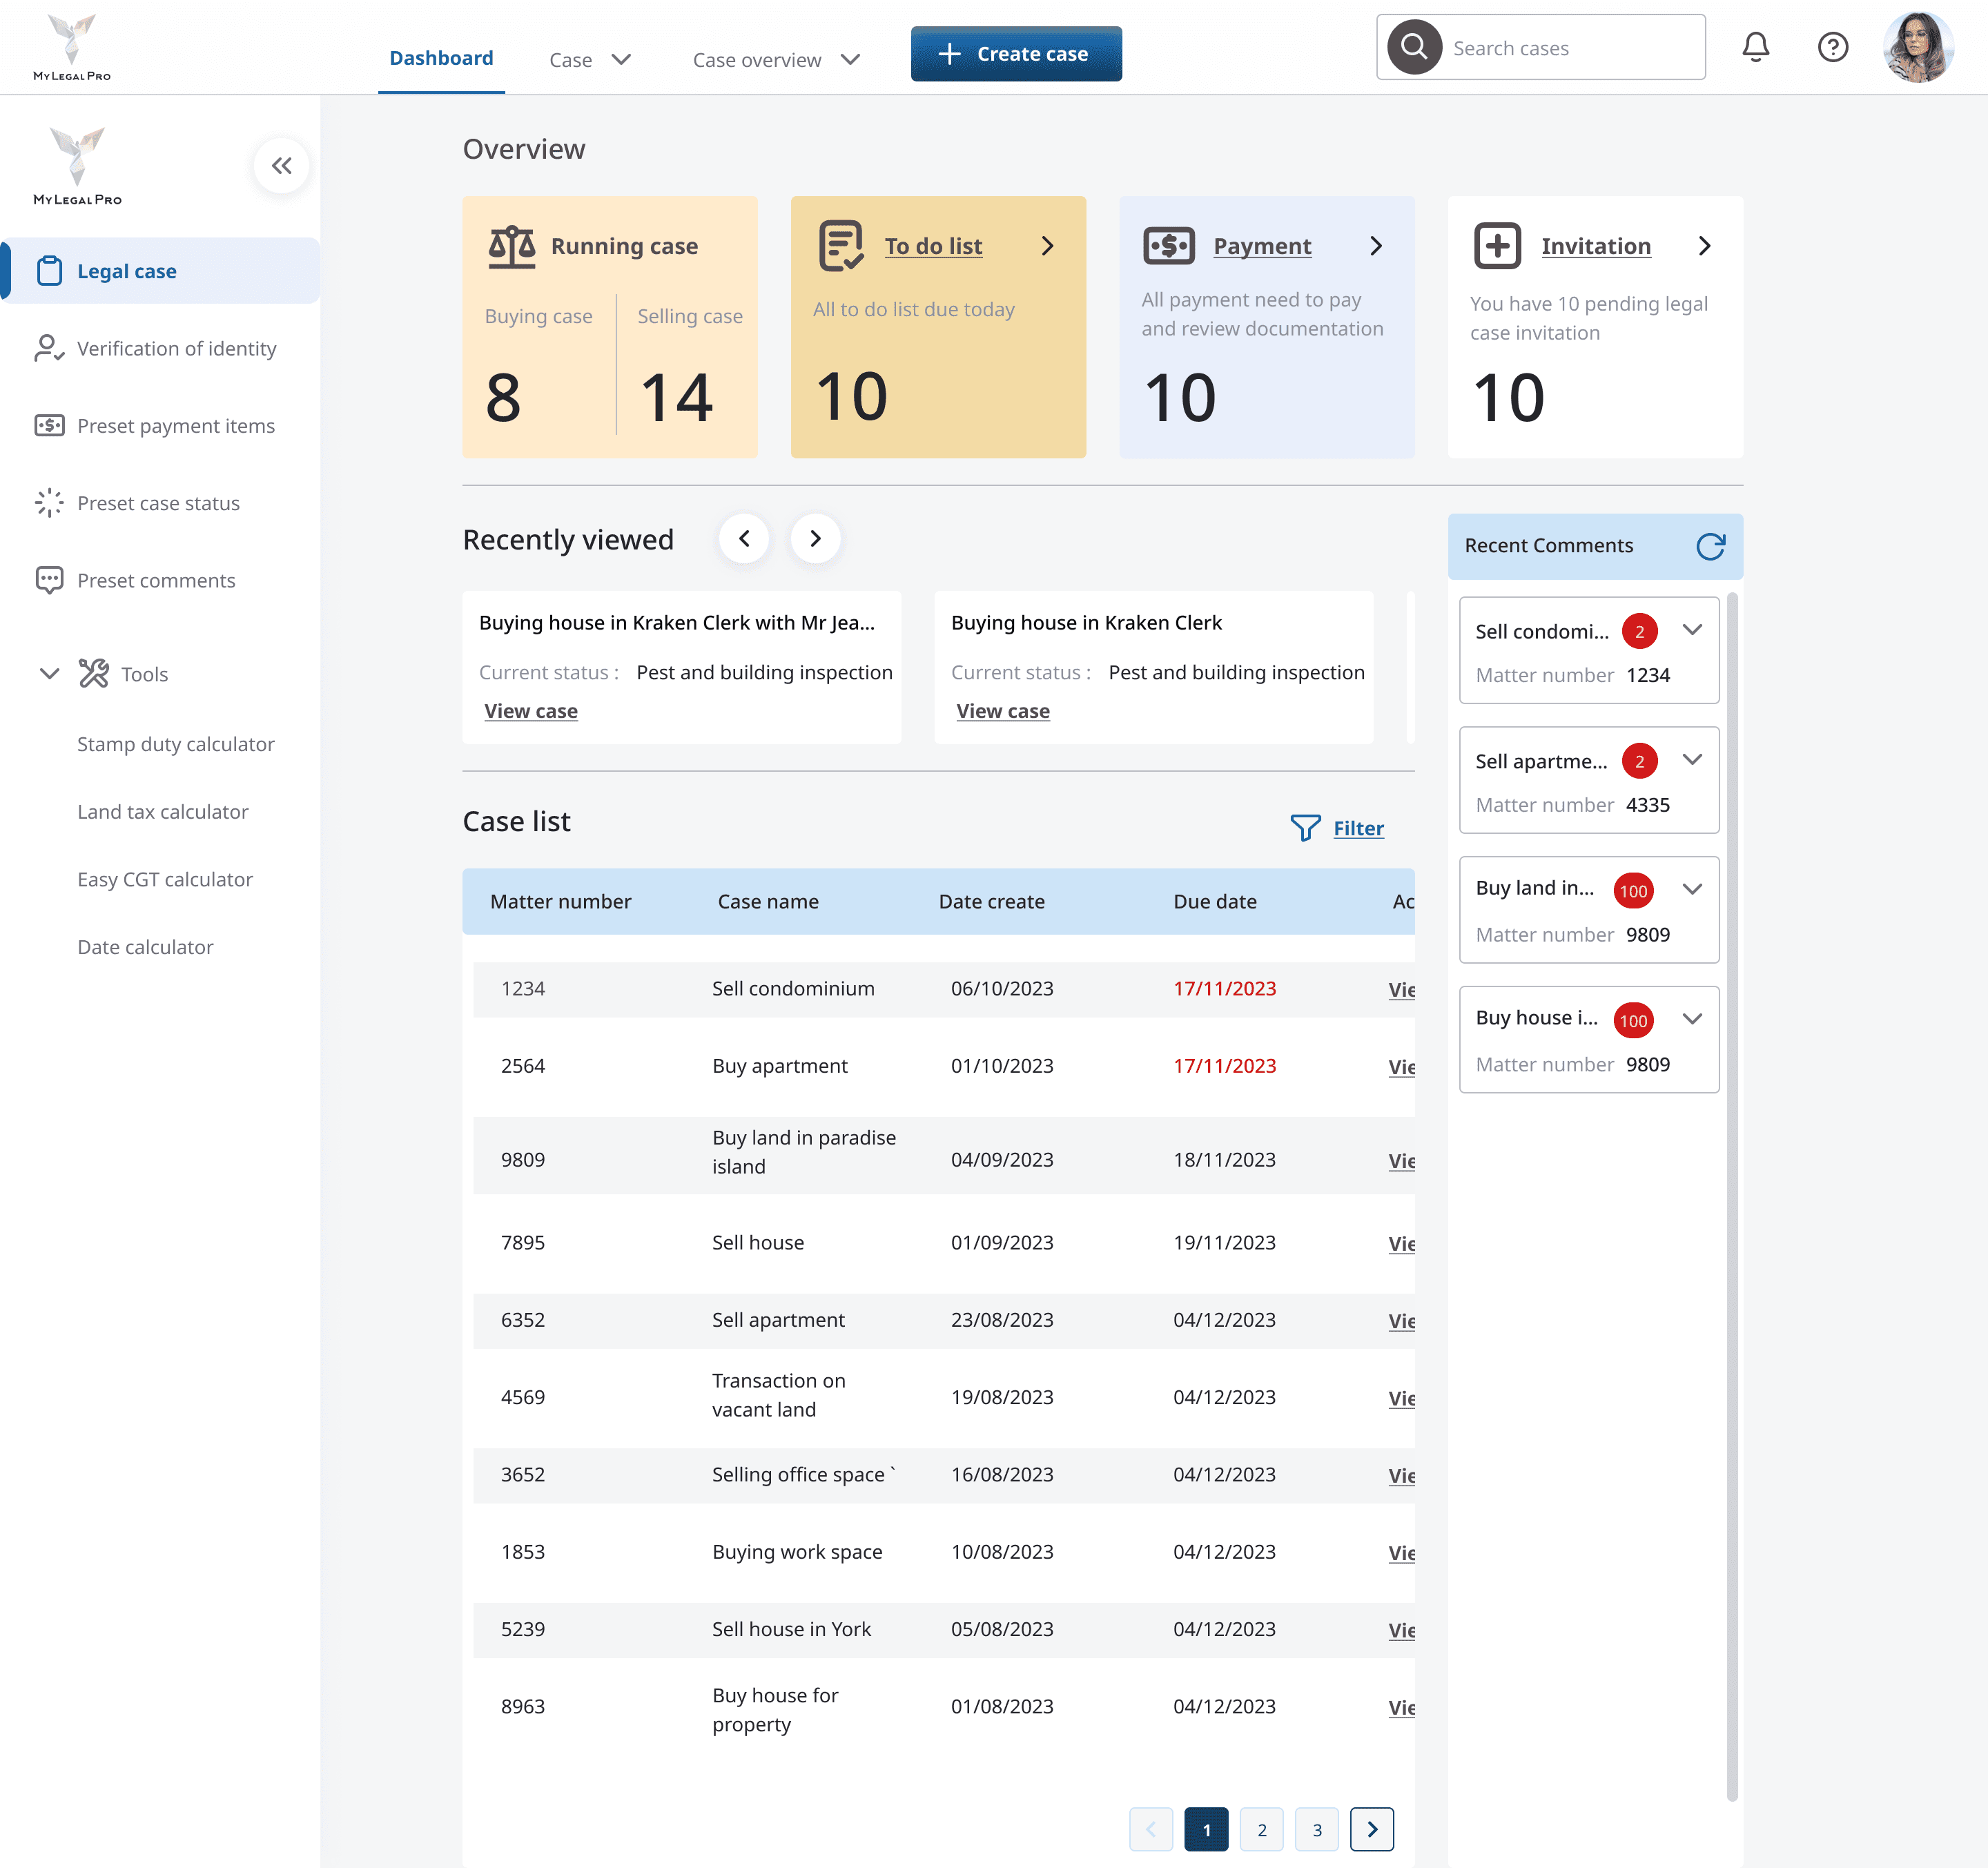

My Legal Pro | Dashboard MVP version
My legal pro is a legal tech company based in Australia and makes digital products related to legal case management for buying and selling property.
Timeline
Q1 2024
Read case study


Revamp : Semaai agent app and daily visit recommendation
Semaai agent application is a productivity application that is used by Semaai sales teams in the field for their selling activities such as attendance, checking achievements and profiling Semaai customer stores and others productivity.
Timeline
Q3 2023
Read case study